Curves
Now that the Fed has raised the Fed Funds rates from effectively zero to .25%, we can move on to the next item on the Wall of Worry to wring our hands over.
In last week’s post, I laid out our broad perspective on where we are in the market cycle. In summary, we are in the middle of an earnings recession, which is primarily being driven by the strong U.S. Dollar and a continued slump in oil prices. [i]

The one thing that is getting some coverage is the concern that we might be entering into an economic recession. As we put in our Q4 Look Ahead there is a large difference in market behavior when comparing economic recessions to earnings recessions. Take a look. [ii]
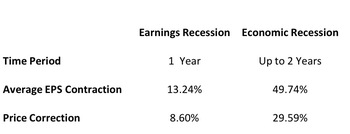
As price corrections are materially different during these two types of recessions, it's prudent for us to constantly assess the possible outcomes.
The best recession indicator, in my opinion, is the yield curve. For those that don't spend their day's analyzing these arcane issues; the yield curve is simply a line that plots interest rates from short-term (3 months) to long-term (30 years) interest rates.
A normal yield curve would have short-term rates lower than long-term rates. When short-term rates are lower than long-term rates, this supports consumers and companies with short-term borrowing. Both are supportive of an expanding economy.
When the yield curve flattens, it suggests an economy that may be in a possible transition from growth to contraction.
When the curve "inverts", short-term rates are higher than long-term rates, that suggests the investors want to be compensated more in the short run for risks they see in the economy.
In fact, according to Jonathan Golub from RBC, "There has never been a recession without (the yield curve) curve first inverting." [iii]

So how does the current yield curve look? [iv]

When you compare the curve now relative to where it was just before the rate increase you can hardly see any movement.
Just for comparison, take a look at how the curve looked just prior to the Great Recession compared to today. You can see a significant difference.

While equity markets will likely continue to have some wild swings as we get comfortable with the new normal, for now, it appears we are still in an earnings recession without an accompanying economic recession.
Let's keep our eye on the curves.
If you have questions or comments, please let us know as we always appreciate your feedback. You can get in touch with us via Twitter, Facebook, or you can email me directly. For additional information on this, please visit our website.
Tim Phillips, CEO – Phillips & Company
Chris Porter, Senior Investment Analyst – Phillips & Company
References:
[i] https://research.stlouisfed.org/
[ii] http://seekingalpha.com/article/2978956-the-earnings-recession-of-2015-stock-market-in-danger
[iii] http://www.businessinsider.com/recessions-and-yield-curves-2015-4
[iv] https://www.treasury.gov/resource-center/data-chart-center/interest-rates/Pages/Historic-Yield-Data-Visualization.aspx
[v] https://www.treasury.gov/resource-center/data-chart-center/interest-rates/Pages/Historic-Yield-Data-Visualization.aspx