It's Not Working
It's Not Working
Weekly Market Commentary 7-8-2013
Tim Phillips, CEO—Phillips & Company
What if the Fed is not talking about tapering their purchases of bonds because the economy is getting better. There is no doubt parts of the economy are improving over the past year:
- Housing starts are up
- Auto sales have risen
- Durable goods orders have risen
What if the Fed is talking about ending their purchases of bonds (QE3) because it's simply not working?
First, let's define what "working" means to the Fed. According to the Federal Reserve Act amended in 1977:
“The Board of Governors of the Federal Reserve System and the Federal Open Market Committee shall maintain long run growth of the monetary and credit aggregates commensurate with the economy's long run potential to increase production, so as to promote effectively the goals of maximum employment, stable prices and moderate long-term interest rates."
What this means in English is that the Fed has a “dual mandate” to promote employment and prevent out of control inflation.[1] Ben Bernanke has taken this to mean that the Fed will continue their asset purchases until unemployment is below 6.5%.
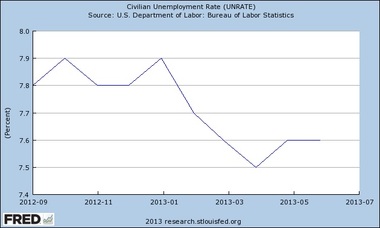
So, how has employment been looking since they began QE3? When the program started in September 2012, unemployment was at 7.8%, and it is currently at…7.6%.[2]

(Source: Federal Reserve)
The employment picture isn’t improving. Even with last week’s great employment report, the averages suggest the Fed’s program is simply not putting enough fuel in the tank for jobs.
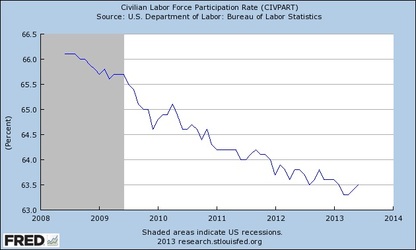
In fact, participation rates (the percentage of people looking for work out of the total working-age population) have dropped, as you can see in the chart below. Remember that the government only counts people as unemployed if they are actively looking for work, so discouraged workers aren’t included.

(Source: Federal Reserve)
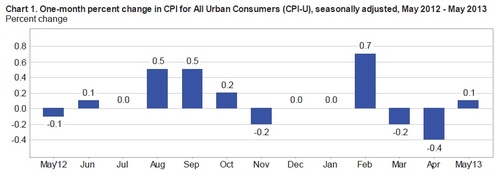
Inflation is not a problem, and in fact we have slipped a little closer to deflation since QE3 began. In March and April, the consumer price index actually dropped.

(Source: Bureau of Labor Statistics)
What we do know that we have gotten from QE3 is asset price inflation in our stock market and housing prices, which you can see below[3]:

All of the Fed's bond purchases were designed to do exactly what has happened: inflate wealth in our personal economies in hopes that we would spend the money—which we have done to an extent. Consumer spending is up 1.4% since the start of QE3, and up 16.9% since the market bottom in March 2009.

(Source: Federal Reserve)
Unfortunately housing prices, stock prices and spending are not the Fed's mandate. Full employment is.
It's clear all of this wealth creation is not creating jobs. Where is it going? Corporate cash balances. Rather than hiring people, corporate cash has risen by $45.8 billion to reach $1.78 trillion, since QE3 began.[4]
The Fed might know one thing: it's dangerous to continue to inflate asset prices and not achieve their goal of improving employment. They might just want to stop.
The Amazon Effect
What if our employment picture is structural rather than cyclical? Perhaps all of these "new economy companies" and "old economy companies" can meet consumer demand with fewer employees.
Amazon employs 91,300 people. Think of all the employees that Borders, Tower Records, Hollywood Video, and Blockbuster used to have—and now they are all gone. It simply takes fewer workers to do the same thing.
Action Item
Although your fixed income portfolios likely, took hits this last quarter, some fixed income sectors performed better than others. Junk bonds held up better than long-term Treasuries, for example.
Duration and fixed income sectors should be managed, but don’t give up on your fixed income allocations altogether. Fixed income helps hedge against stock pullbacks and deflation, and it helps provide your portfolio with a predictable level of income.
If you have questions or comments, please let us know as we always appreciate your feedback. You can get in touch with us via Twitter, Facebook, or you can email me directly. For additional information on this, please visit our website.
Tim Phillips, CEO – Phillips & Company
Alex Cook, Investment Analyst – Phillips & Company
[1] Federal Reserve
[2] Ibid.
[3] Source: Bloomberg and S&P Dow Jones Indices LLC. S&P 500 data from Sept. 13, 2012 to July 5, 2013. Case-Shiller data from September 2012 to April 2013, as April 2013 is the most recent month available.
[4] “Flow of Funds Accounts of the United States—Nonfinancial corporate business; total financial assets”, June 6, 2013, Federal Reserve