Knowing How to See
One of Leonardo da Vinci’s mottoes was “saper vedere”, which translates to “knowing how to see.” It refers to the continual refinement of our senses, especially sight, as a means to enrich experience and test knowledge. With the mountain of economic data released in the last week (see the table below), this is a good opportunity to practice “saper vedere” to develop an overall picture of the state of the economy and where it may be headed.[i]
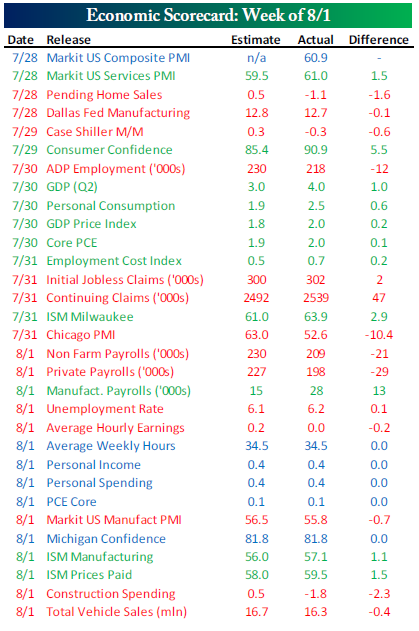
Let’s examine some of this data and see what narrative develops. It is important to emphasize that these data points are lagging indicators, which follow changes in the economy and reflect historical performance.
Q2 GDP grew 4.0%, a welcome change from the negative growth rate in Q1. From the component analysis provided by our friends at Bespoke, we can see positive contributions to GDP in consumption and investment.[ii]
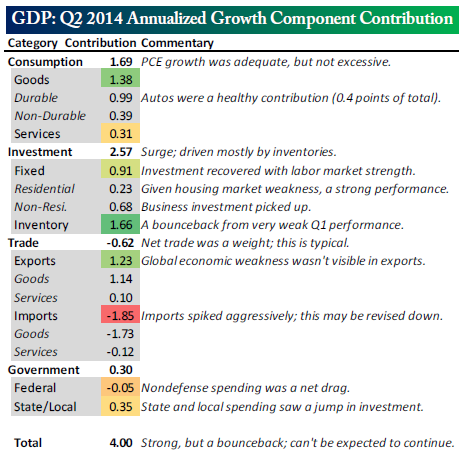
The strong inventory build-up came after two quarters of declines. Bespoke noted that we can’t expect inventory growth of 1.66% annualized per quarter, but with demand growing at 2%, some continued growth should be expected.[iii] Consumption growth and fixed investments were also positive. Business investment recovered with labor market strength.
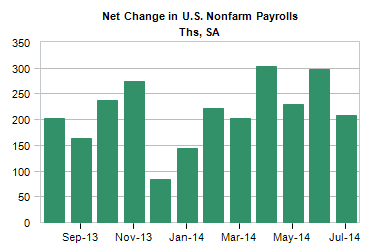
On the jobs front, payrolls grew by 209,000, but the unemployment rate ticked up one-tenth of a percent to 6.2%.[iv]
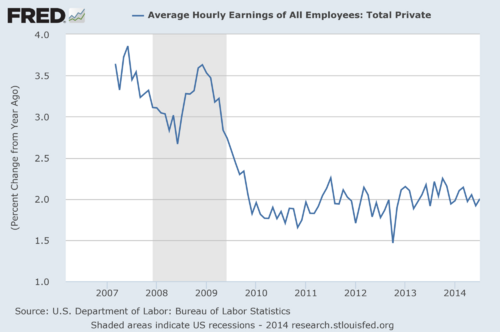
The unemployment rate uptick was caused by an increase in labor force participation, workers coming off of the “sidelines” and re-entering the workforce, another sign of a growing economy. While it’s good news for more Americans to have jobs, until the slack in the labor force is exhausted wage growth will be limited.[v] On the plus side, 2% wage growth may help keep inflation in check and interest rates low.
Overall, Q2 data shows a growing economy and workforce, but will this continue into the second half of the year? Let’s look at some leading indicators that provide clues for Q3.
More Americans with jobs contributed to increased consumer confidence with the Consumer Confidence Index jumping to 90.9 in July from 86.4 in June, its highest reading since October 2007 and above economists’ estimates of 85.0. [vi]
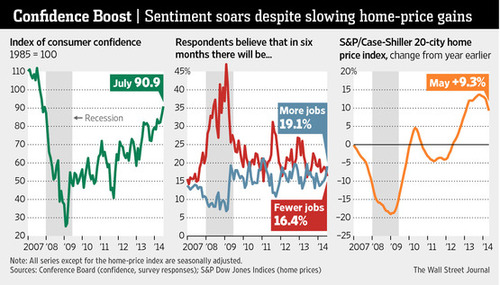
More confident consumers will be important for second half economic growth, as about 70% of GDP comes from consumption.[vii]
Based on the Case-Shiller 20-city home price index, housing prices rose at a slower rate, but are still increasing from a year ago.[viii] Rising home prices can give consumers more confidence about their financial situation and can be a source of borrowing to fund purchases.
The ISM Purchasing Managers’ Index increased to 57.1 in July from 55.3 in June. Values above 50 indicate expansion.[ix]
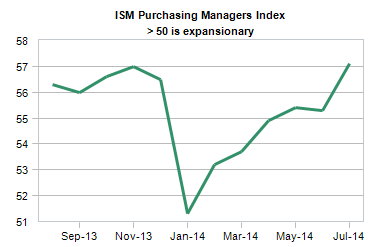
The ISM report also showed that inventories fell to 48.5, while new orders increased to 63.4. The widening gap between orders and inventories is good news for future production.[x]
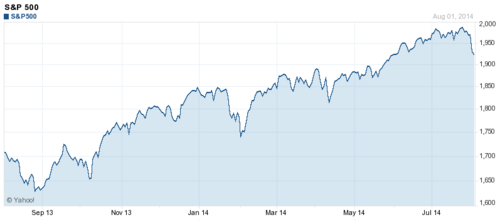
Finally, while we experienced some volatility last week, the stock market has been reaching new highs.[xi] The stock market is a leading indicator, as it factors in current data as well as expectations for future corporate earnings growth.
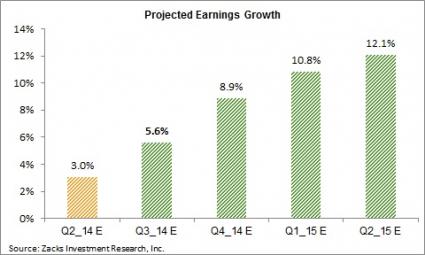
Q2 earnings have been generally positive and analysts forecast stronger growth in the second half of the year and into 2015.[xii]
Looking across all of these data points, the US economy had strong Q2 growth and there are signs for more growth to follow. The manufacturing and business investment numbers point to an expanding economy, which should lead to more employment and higher consumer confidence.
The questions, which we have raised before, are:
- Will the increased consumer confidence will translate into more spending to drive continued GDP growth?
- Will the improving economic data be reflected in earnings growth, which is the sustainable driver of equity returns?
We’ll watch the next retail sales report coming up later this month and continue to monitor the Q3 earnings projections. Hopefully they confirm the positive signs that we are seeing so far. With such strong earnings forecasts, any disappointment may lead to more volatility in the market.
If you have questions or comments, please let us know as we always appreciate your feedback. You can get in touch with us via Twitter, Facebook, or you can email me directly. For additional information on this, please visit our website.
Tim Phillips, CEO – Phillips & Company
Jeff Paul, Senior Investment Analyst – Phillips & Company
References
[i] Bespoke Investment Group. (Aug 1, 2014). The Bespoke Report: What to Remember from a Week to Forget. p 7.
[ii] Ibid., p 9.
[iii] Ibid., p 8.
[iv] Koropeckyj, S. (Aug 1, 2014). United States: Employment Situation. Moody’s Analytics.
[v] Federal Reserve Economic Data.
[vi] Madigan, K. (July 29, 2014). U.S. Consumer Confidence Rises. The Wall Street Journal.
[vii] JP Morgan Asset Management (June 30, 2014). 3Q 2014 Guide to the Markets. p 17.
[viii] Madigan, K. (July 29, 2014). U.S. Consumer Confidence Rises. The Wall Street Journal.
[ix] Sweet, R. (Aug 1, 2014). United States: ISM Manufacturing Index. Moody’s Analytics.
[x] Ibid.
[xi] Yahoo Finance. (Aug 1, 2014). S&P 500 historical chart.
[xii] Mian, S. (July 8, 2014). It’s All About the Guidance. Zacks Research.