Do Nothing......Recently?
Aside from your health, it's hard to imagine any endeavor other than investing where the outcomes can change so rapidly and matter so much.
If you examined equity performance before last week, you might have felt like you were exploring the depths of another major pull back. With the instantaneous media, access to so-called "credible" opinions, and real-time stock pricing at your fingertips, it's no wonder you might have felt anxious.[i]
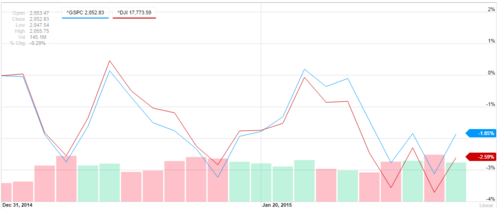
[Note: Dow Jones Index (red line), S&P 500 (blue line).]
Now examine how strong a recovery we witnessed during the week. The S&P 500 was up 3.03% and the Dow was up 3.84%.[ii,iii,iv]
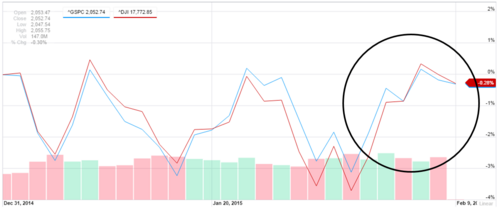
[Note: Dow Jones Index (red line), S&P 500 (blue line).]
The bias to do something in the face of challenges is a common human reaction. It's very counterintuitive to just stand there.
That's why we rely on data to determine actions. Last week’s data was indeed very positive. To date, Q4 earnings have crushed estimates (71.8% of companies have beaten expectations), but overall growth (7.1%) is still below long-term averages (7.4%).[v]
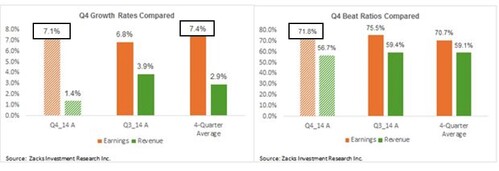
We also had the following strong data on the general economy:[vi]
- Nonfarm payrolls increased 257,000 last month, beating Wall Street forecasts.
- Job creation data for November and December 2014 was revised upward by 147,000.
- January marked the 11th straight month of job gains above 200,000, the longest streak since 1994.
- The labor force participation rate rose 0.2% to 62.9%, indicating that more working-age Americans are employed or at least looking for a job.
- Average hourly wages increased 12 cents last month, the largest gain since June 2007. Higher wages and lower fuel prices should provide a tailwind for consumer spending.
It's easy to get myopic in the face of bad data and react, particularly when your portfolio underperforms its respective benchmarks in the short run. It's critical to your success and well-being to stand back and reflect. Our job is to help you do just that.
First, if you have a properly allocated portfolio and a targeted rate of return, your objectives dictate you can expect to spend 40% of the time underperforming that benchmark over a 10-year period.[vii]
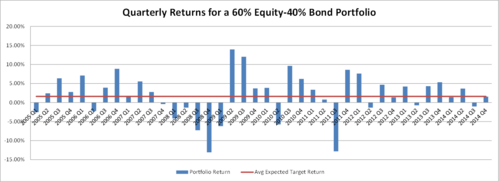
Conversely, you can also expect to spend 55% of the time outperforming that target. A mere 5% of the time your allocation will perform in-line with your expectations.[viii]
If you reacted each time you were disappointed from underperforming your benchmark, you would have a mess on your hands. “Don't do something, just stand there” while backwards sounding, has strong medicine for investors.
- Figure out what your portfolio needs to return over a long period of time.
- Build a prudent allocation that matches those return objectives and time frame.
- Rebalance appropriately.
- Try not to time the markets, while still managing the risks.
- Trust the long term averages and first principals of investing.
It's simple, but not easy. In fact, a recent (self-serving) survey suggested professionals can add up to 1.5% just on behavioral coaching.[ix] That's exactly what you should use us for - helping you to avoid the bias to action at times and to stay focused on your long-range performance expectations.
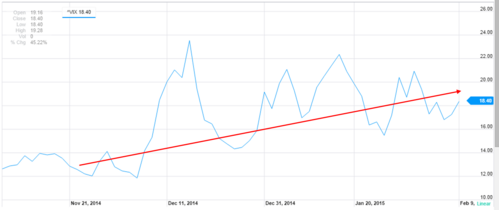
While volatility is increasing recently, you should rely on us for the appropriate amount of coaching.[x]
A revisit of your investment timeframes to continually adjust your target returns is always necessary. We will continually do our best to allocate to your objectives.
Sometimes it's a matter of doing something and sometimes it's a matter of just standing there.
If you have questions or comments, please let us know as we always appreciate your feedback. You can get in touch with us via Twitter, Facebook, or you can email me directly. For additional information on this, please visit our website.
Tim Phillips, CEO – Phillips & Company
Jeff Paul, Senior Investment Analyst – Phillips & Company
References
[i] Google Finance. (Feb 9, 2015). S&P 500 / Dow Jones Index chart (12/31/14-1/31/15).
[ii] Google Finance. (Feb 9, 2015). S&P 500 / Dow Jones Index chart (12/31/14-2/6/15).
[iii] Google Finance. (Feb 9, 2015). S&P 500 historical prices.
[iv] Google Finance. (Feb 9, 2015). Dow Jones Index historical prices.
[v] Mian, S. (Feb 6, 2015). Q1 Earnings Estimates Falling Sharply. Zacks Research.
[vi] Mutikani, L. (Feb 6, 2015). Strong U.S. job, wage gains open door to mid-year rate hike. Reuters.
[vii] Phillips & Company. (Jan 2015). Portfolio Returns over Time.
[viii] Ibid.
[ix] Kinniry Jr., F., et. al. (Mar 2014). Putting a value on your value: Quantifying Vanguard Advisor’s Alpha. Vanguard research.
[x] Yahoo Finance. (Feb 9, 2015). Volatility S&P 500 – VIX.