Cross Over Period
Cross Over Period
The end of Q2 was anything but a sleeper for US and Global equities. You can see from the table below the results were a yawner for US Equites but the volatility was far from it.
Comparison of Q2 Index Price Change vs. Volatility
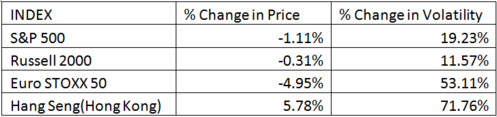
(i)(ii)
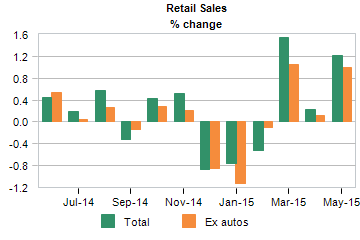
The general theme that pervaded Q2, at least in the US, was an improving macro-economic picture.
Retail Sales were up!(iii)
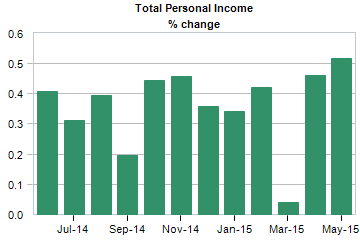
Personal Income is on the rise!(iv)
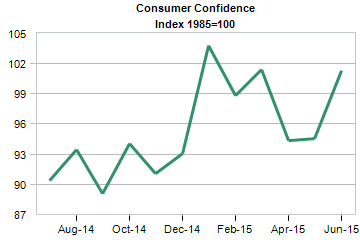
Consumer Confidence is nearing peak levels!(v)
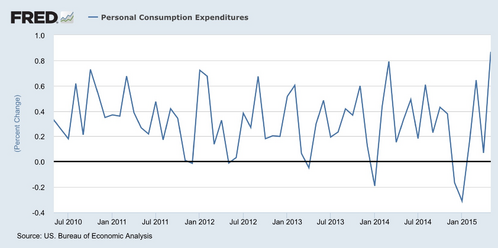
The change in Personal Consumption was strong!(vi)
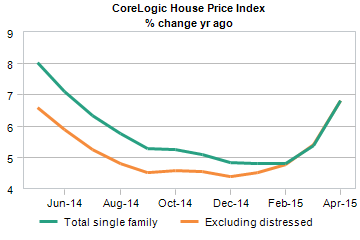
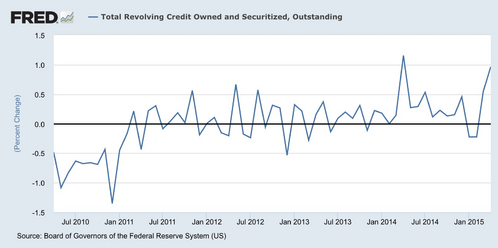
Home prices are surging and the consumer is feeling strong enough to take on more revolving credit!(vii)(viii)
As 70% of the US economy is consumption focused, all the indicators are looking very good.
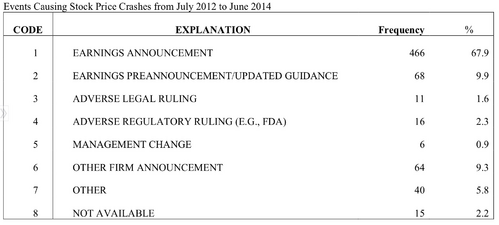
Here's the rub. When you look at what causes stock prices to collapse the most it’s not macro-economic events; it's earnings. In a recent study on movement in stock prices, earnings announcements were the leading cause for prices to crash.(ix)
If earnings really drive stock prices, let's take a look at Q2 expectations. (x)(xi)
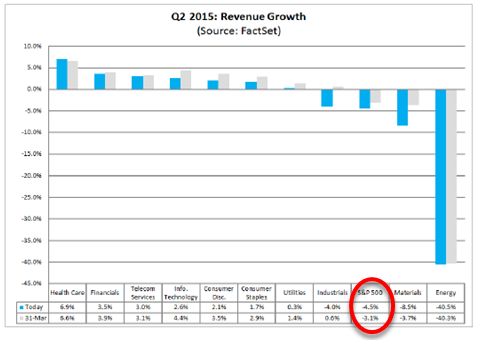
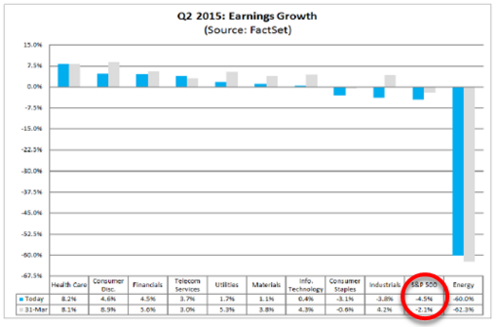
You can see from the chart provided by Fact Set both earnings and revenue are expected to shrink not grow. In fact, expectations have grown a bit more dismal since last reviewed. Again, these are estimates from Wall Street prognosticators so take that for what it's worth.
According to Fact Set, this is the worst revenue growth projection since Q3 2009 when revenue declined by -11.5%.(xii)
So how is it possible to have such strong consumer economic metrics and abysmal expectations for corporate profits? One reason is the strong US Dollar. Stay tuned for our Q3 Look Ahead to see the impact and details on that issue. Another reason is the overall impact of energy prices on the S&P 500. After all, energy makes up 7.9% of the S&P 500.(xiii) Further, and in my opinion, the most likely scenario is the lag effect of the indicators I've cited above and corporate profits.
Some of the indicators are lagging, some are leading and some are coincident as it relates to the overall economy. However, in my estimation, corporate profits all lag these indicators by several weeks to months.
Perhaps we are going to have a nice upside surprise when Q2 earnings announcements begin shortly? Perhaps we will have to wait till the second half of 2015. In any case, if the macro trends hold true, we may experience a nervous period in the next several weeks as we "cross over" this precarious period.
Special Note on Greece

In a prior post we discussed Greece in detail. In light of what has transpired on Sunday here is our summary view on Greece:
- Germany, as one of the largest exporters in the world, will want to continue to use Greece as a currency puppet. Greece weakens the Euro which helps German exports.
- The EU does not want to see anti-austerity parties gain control and will provide new tools and regulations to help debtor countries like Spain and Italy.
- The EU will do what they do best and try to unite and regulate. Currently they have a monetary union and the outcome will likely be an organized effort to create a fiscal union between EU members. That will look like consistent retirement benefits, paternal benefits, lending and banking regulations and perhaps some free movement of labor (although I doubt they will archive this one).
None of this should impact earnings growth of underlying European companies, whether Greece leaves or not.
If you have questions or comments, please let us know as we always appreciate your feedback. You can get in touch with us via Twitter, Facebook, or you can email me directly. For additional information on this, please visit our website.
Tim Phillips, CEO – Phillips & Company
References:
(i) Google Finance
(ii) Bloomberg
(iii) Moody’s Analytics
(iv) Moody’s Analytics
(v) Moody’s Analytics
(vi) Federal Reserve Bank of St. Louis
(vii) Moody’s Analytics
(viii) Federal Reserve Bank of St. Louis
(ix) Navigating Stock Price Crashes - June 2015, B Korcan Ak, Steve Rossi, CFA, Richard Sloan, Scott Tracy, CFA
(x) Factset Earnings Insight – July 2, 2015
(xi) Factset Earnings Insight – July 2, 2015
(xii) Factset Earnings Insight – July 2, 2015
(xiii) S&P 500 Factsheet- June 30, 2015, McGraw Hill Financial