Don't Get Stuck Watching the Shiny Object
The media outlets remain saturated with continuous talk about the surprise turnout from the Presidential election, as well as the ongoing speculation about how the next four years will play out with Trump and his Administration at the helm. With all the buzz, it's easy to lose sight of what ultimately matters in the short run: The consumer.
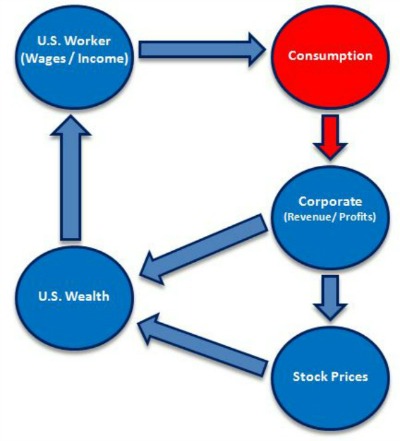
While all things Trump might dominate the media, the consumer remains the dominant force in our economy, therefore the ultimate influencer with respect to corporate earnings. The blueprint is pretty simple: As the U.S. worker consumes, this leads to corporate revenue and profits which leads to higher stock prices. The higher the stock price of a company, the more U.S. wealth is accumulated, which goes back into the pockets of the U.S. worker. This then leads to more consumption, as the cycle continues.
So, what are the inputs that drive consumption you may ask? Let’s review…
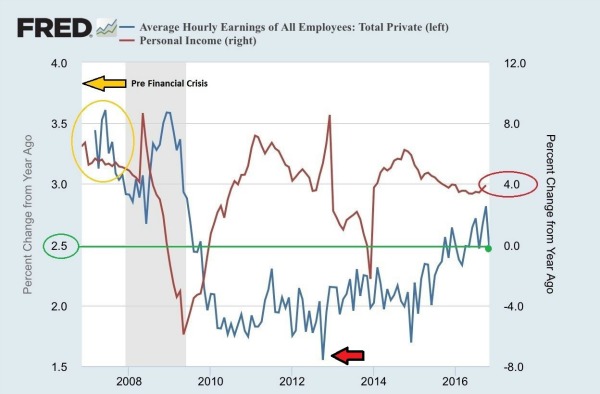
First, wages and income are experiencing growth. Personal income – the income to persons derived from wages, salaries, and other revenue – is growing around the 4% [i] range and average hourly earnings are growing at 2.5% [ii]. While still not pre-financial crisis levels, they are better than the 1.5% we were experiencing a few years ago [ii].
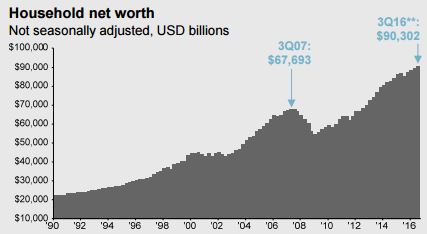
The second input to drive consumption is the wealth of the consumer. As you can see from the chart below, courtesy of our friends at J.P. Morgan Asset Management, household net worth has climbed 25% beyond the peak of pre-recessionary levels [iii].
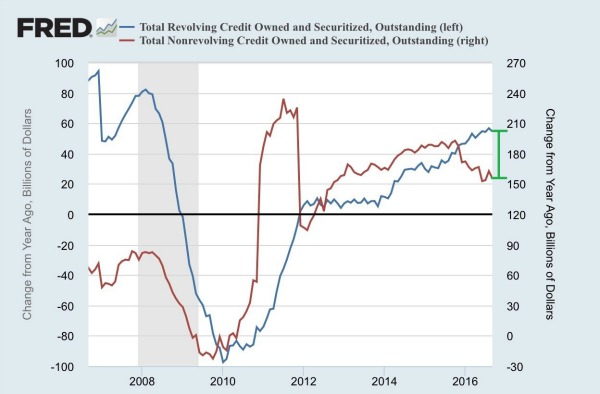
Third is the consumers’ willingness to borrow in order to fund their consumption. U.S. consumers have been taking out more debt to finance their purchases. Both revolving and non-revolving credit have been expanding at reasonable rates. Yet, there has been an interesting shift from non-revolving credit growth (mortgages, auto loans, and college loans) to more consumables, which is reflected in revolving credit growth [iv]. You can see the divergence in the chart below.
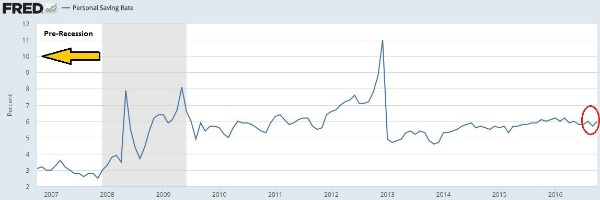
The fourth and last, but certainly not least, factor is something that we like to refer to as “dry-powder.” Right now the consumer maintains a much higher savings rate at 6% [v]. If we look at this number from pre-financial crisis in 2008, the consumer had a savings rate as low as 2.5% [vi]. Relative to 2008, that's a lot of extra reserves. With consumer confidence on the rise, up 5% from this time last year [vii], we could likely see some of those reserves flow back into the economy in the form of higher consumption. In fact, we have already seen signs that the consumer has been willing to spend down a portion of those savings, and if that continues, that would be a strong indicator to ongoing growth in the economy [viii].
Let's not get distracted by the shiny Trump media buzz. If we focus on what ultimately matters, there looks to be strong tailwinds ahead for U.S. consumption growth, which will likely translate into continued future corporate earnings growth.
If you have questions or comments, please let us know as we always appreciate your feedback. You can get in touch with us via Twitter, Facebook, or you can email me directly. For additional information on this, please visit our website.
Tim Phillips, CEO – Phillips & Company
Robert Dinelli, Investment Analyst – Phillips & Company
References:
[i] https://fred.stlouisfed.org/series/A067RP1A027NBEA
[ii] https://fred.stlouisfed.org/series/CES0500000003
[iii] https://phillipsandco.com/files/5614/8097/7801/MI-GTM_4Q16_December.pdf
[iv] https://fred.stlouisfed.org/series/REVOLSL
[v] https://www.economy.com/dismal/indicators/releases/usa_income
[vi] https://fred.stlouisfed.org/series/PSAVERT