Draining The Tank
According to the Bureau of Economic Analysis, the U.S. economy expanded at a respectable 2.6 percent in Q2. [i]
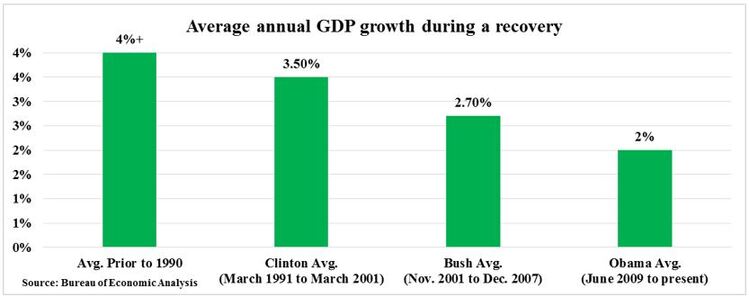
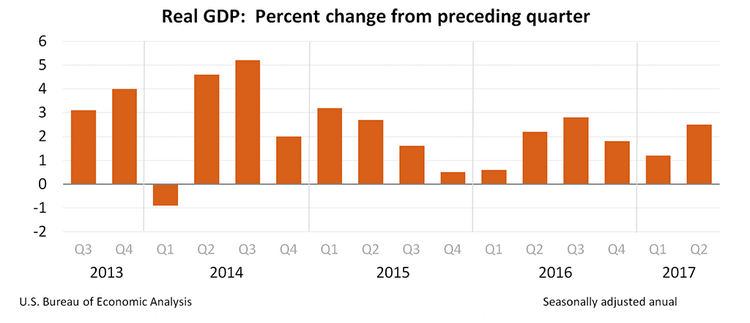 This reverses two-quarters (2016Q4 and 2017Q1) of slowing GDP growth [i], and firmly establishes that the U.S. economy is expanding, albeit at a much slower pace than historic recoveries. [ii]
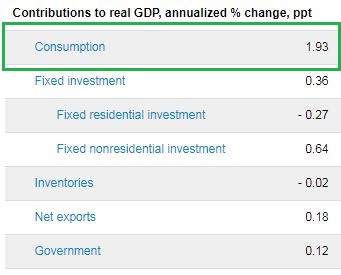
Much of this growth can be attributed to the strength of the U.S. consumer. In Q2, consumption contributed 1.93 percentage points to GDP growth, which is preferable since consumption makes up 70 percent of U.S. GDP. [iii]
Some of the leading contributory components within the “Consumption” category are Recreational Goods and Vehicles (0.26 percent), Clothing and Footwear (0.19 percent), Household Utilities (0.35 percent), Healthcare (0.35 percent), and Financial Services and Insurance (0.18 percent). [iv]
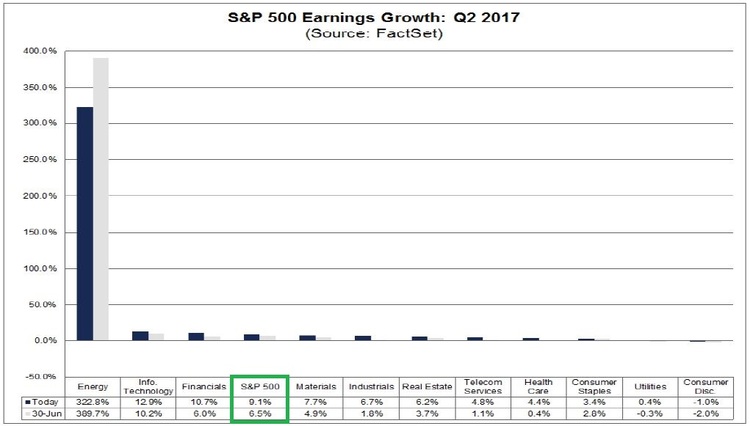
This clearly supports the strong corporate earnings picture that has been developing as companies continue to report solid Q2 earnings. With 57 percent of companies already reported in the S&P 500, earnings growth is now anticipated to end Q2 at 9.1 percent, which is remarkable, especially when you consider that we started reporting season expecting earnings to grow by only 6.5 percent. Not too shabby. [v]
But let’s not pop the champagne corks just yet. There is some indication that the consumer is beginning to drain the consumption fuel tank, as evidenced by the downward revision of the U.S. Personal Savings Rate to 3.6 percent, down from a previously published 4.9 percent, the lowest level in nine years. [vi]
It’s easy to make the connection between the decline in personal savings and the increase in consumption, specifically in goods and services, which helps the expansion in corporate earnings. By and large, you can see that consumer confidence, as measured by consumer sentiment, is clearly growing after the Great Recession. [vii]
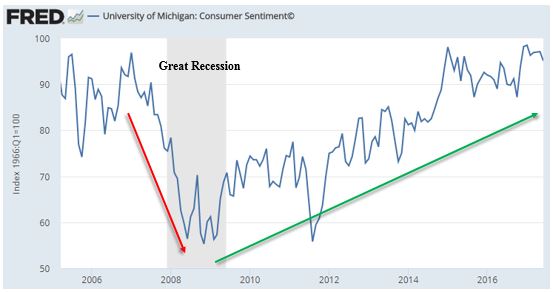
If history is any indicator, we can’t rely solely on the U.S. consumer to save less and become the driving force for consumption.
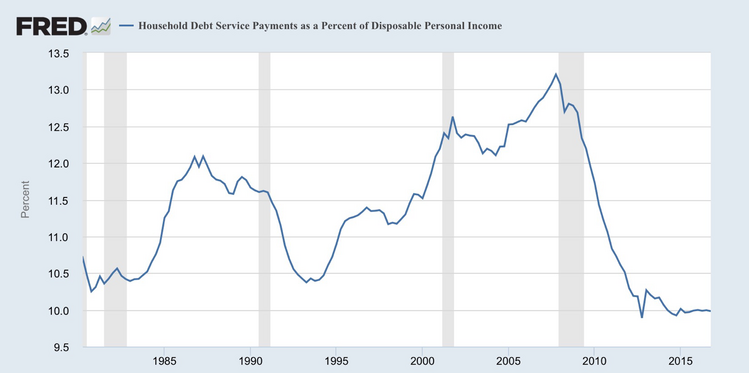
The silver lining, if you can call it that, is that the U.S. consumer has ample room to borrow. Take a look at the percentage of debt service (payments) relative to income. At 10 percent, it’s at historic lows and well off the 13 percent high during the 2009 recession. [viii]
This is a good sign because this could help propel corporate earnings. FactSet projects that Q3 earnings will grow at 6.1 percent, Q4 earnings will grow at 11.7 percent, and all of 2017 will post 9.5 percent earnings growth. [v]
Just to be clear, this does not mean that investors should be piling into risk assets. Quite the contrary. It’s likely that we are getting closer to the end of our expansion cycle here in the United States, although that’s extremely hard to predict.
According to a recent memo by famed billionaire and distressed debt investor Howard Marks, many conditions presenting themselves suggest moderating expectations. His whole memo can be viewed HERE; however, we have summarized a short list below [ix]:
- The S&P 500 is selling at 25 times trailing-twelve-month earnings, compared to a long-term median of 15.
- The Shiller Cyclically Adjusted PE Ratio stands at almost 30 versus a historic median of 16. This multiple was exceeded only in 1929 and 2000 – both clearly bubbles.
- While the “p” in p/e ratios is high today, the “e” has probably been inflated by cost cutting, stock buybacks, and merger and acquisition activity. Thus today’s reported valuations, while high, may actually be understated relative to underlying profits.
- The “Buffett Yardstick” – total U.S. stock market capitalization as a percentage of GDP – is immune to company-level accounting issues (although it isn’t perfect either). It hit a new all- time high last month of around 145, as opposed to a 1970-95 norm of about 60 and a 1995- 2017 median of about 100.
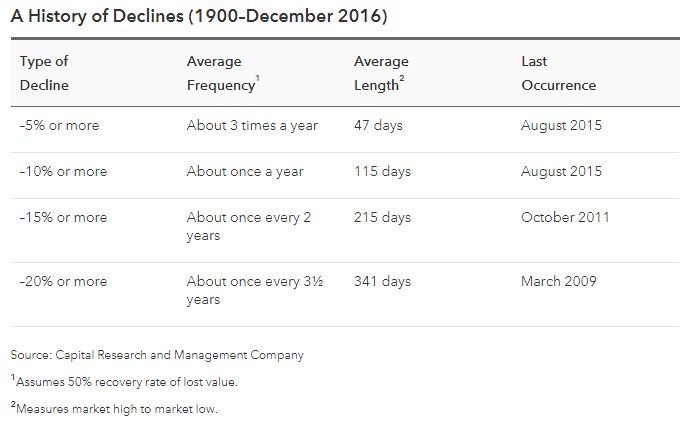
While we always expect a normal correction – and so should you – the fuel in the U.S. consumer tank has begun to drain. Although it remains to be seen, if consumers are willing to lever up, the party should roll forward. But if consumers suddenly get cautious, trouble may be near. [x]
 .
.
If you have questions or comments, please let us know. We always appreciate your feedback. You can contact us via Twitter and Facebook, or you can e-mail me directly. For additional information, please visit our website.
Tim Phillips, CEO, Phillips & Company
Robert Dinelli, Investment Analyst, Phillips & Company
References:
i. https://www.bea.gov/newsreleases/national/gdp/gdpnewsrelease.htm
ii. https://www.bea.gov/national/#gdp
iii. https://www.economy.com/dismal/indicators/releases/usa_gdp/C8FEDBED-1CF2-4FB6-AC20-C0BCB55A3049/United-States-GDP
iv. https://www.bea.gov/newsreleases/national/gdp/2017/pdf/gdp2q17_adv.pdf
v. https://phillipsandco.com/files/5115/0152/2345/EarningsInsight_072817.pdf
vi. https://www.bloomberg.com/news/articles/2017-07-28/revisions-send-u-s-saving-rate-to-nine-year-low-at-end-of-2016
vii. https://fred.stlouisfed.org/series/UMCSENT/
viii. https://fred.stlouisfed.org/series/TDSP
ix. https://phillipsandco.com/files/9915/0152/2360/there-they-go-again-again.pdf
x. https://www.americanfunds.com/individual/planning/market-fluctuations/past-market-declines.html