Looking Forward

Happy Monday to everyone. Today we released our Q1 2018 Quarterly Look-Ahead.
For the PDF presentation, click here.
For the narrated presentation, click here.
One of the things I always find entertaining from the first quarterly look-ahead of a new year is the market predictions from the top major Wall Street firms. In particular, I think it is comical how often these firms have gotten it wrong over the years. Needless to say, Phillips & Company exists and thrives because traditional Wall Street firms and big banks are failing their customers. Look no further than Wells Fargo.
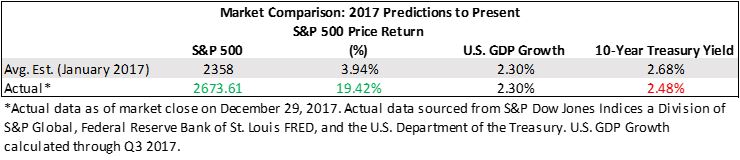
However, these firms are unabashed by their belief that investors seem to rarely hold them accountable for their ridiculous predictions. In our last market commentary of 2017, we showed just how poorly Wall Street firms missed the mark.
One thing not included in our Look-Ahead (mostly because we ran out of room) was an interesting chart that shows just how volatile equity returns can be. This holds especially true after 2017 when we had no negative monthly returns in the S&P 500. In fact, that is the first time it has happened going back to 1990. [i]
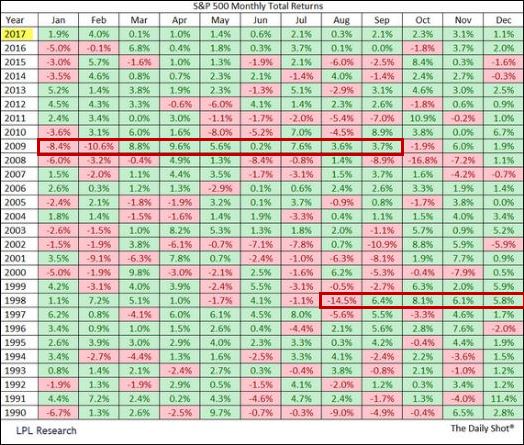
Just look at the returns following a terrible August 1998, or even the returns following a combined 19 percent market correction in January and February of 2009 [i]. When I look at this chart, it demonstrates some of the key points:
- Equity returns happen in brief bursts and often just after significant corrections.
- It is far too hard to attempt to predict these monthly market activities.
- There are far more up-months than down-months.
- Corrections happen, and we should accept them the way that we accept breathing as a necessity of life.
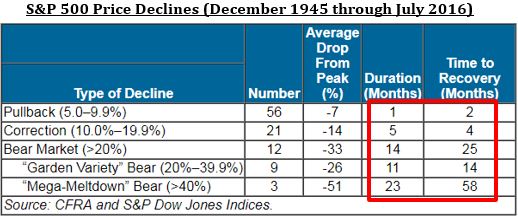
- Corrections happen but do not generally last that long [ii]; you’ll find more on this in the Q1 2018 Look Ahead.
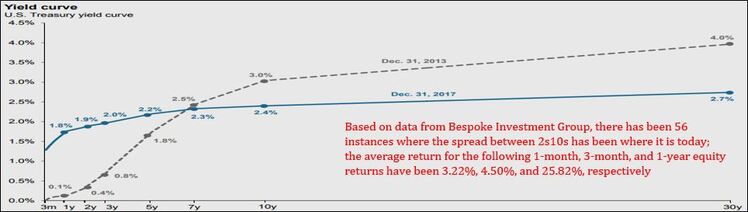
Another interesting point to highlight in our Q1 2018 Look Ahead is how flat the yield curve is. However, keep in mind that markets react to this much later in the cycle.
For more on Phillips & Company insights, we hope you have a chance to listen to our narrated Q1 2018 Look Ahead presentation.
If you have questions or comments, please let us know. You can contact us via Twitter and Facebook, or you can e-mail Tim directly. For additional information, please visit our website.
Tim Phillips, CEO, Phillips & Company
Robert Dinelli, Investment Analyst, Phillips & Company
References
i. https://dailyshotbrief.com/the-daily-shot-brief-january-3rd-2018/
ii. https://phillipsandco.com/files/9615/1519/3009/Look_Ahead_2018Q1_-_Final.pdf