Panic Is Not an Investment Strategy
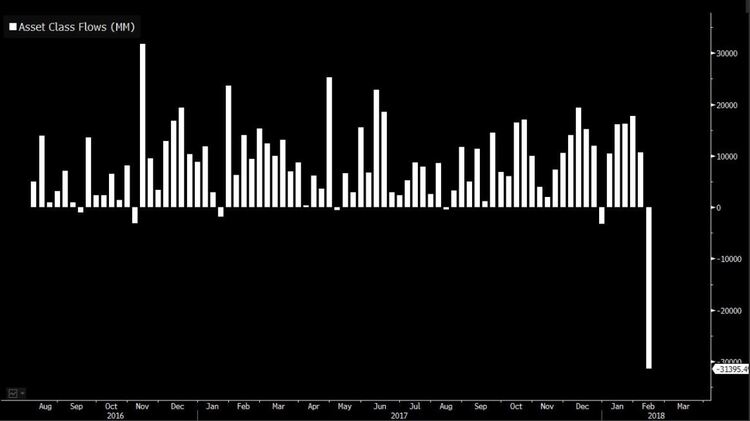
 Exchange traded funds had their largest sell-off in eighty weeks, as investors ran for cover. [i]
Panic is not an investment strategy. How do I know this? Shamefully, I tried it once. It’s been more than three decades, but the memories and lessons I learned still linger in my brain more than thirty years later.
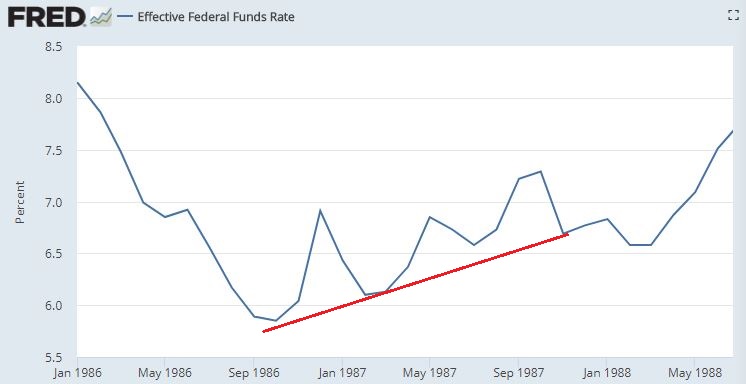
My second year as a licensed professional was 1987. I had huge desire but little skill to apply to my craft. Then, like now, circumstances were similar in a few macroeconomic and fundamental ways.
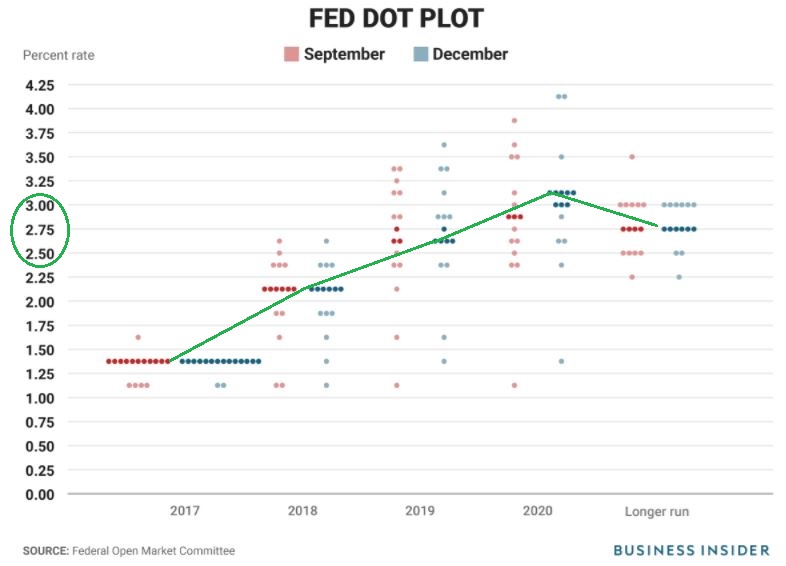
“If the economy evolves as I anticipate, I believe further increases in interest rates will be appropriate this year and next year, at a pace similar to last year’s.” – Cleveland Federal Reserve President and CEO Loretta Mester [iii]
First, interest rates were on the rise. [ii] Despite rates being much higher in 1987 than they are now, rates are expected to increase, albeit not to the levels we were at in 1987. [iv]
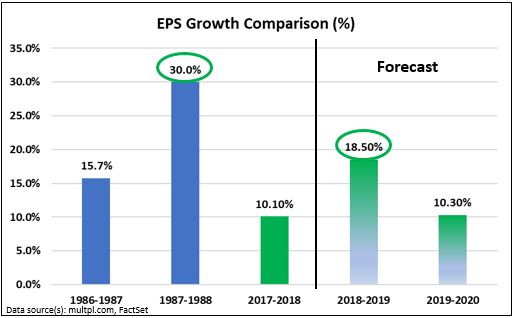
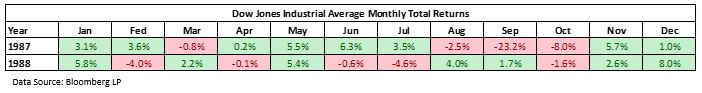
Second, earnings per share were also expanding at double-digit growth rates in 1987 and 1988. Like then, we are experiencing double digit earnings per share growth now, with forecasts indicating this should persist in 2018 and 2019. [v][vi]
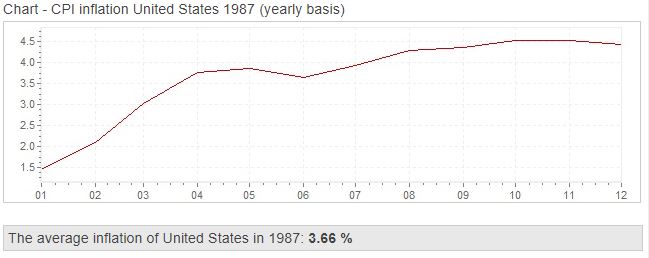
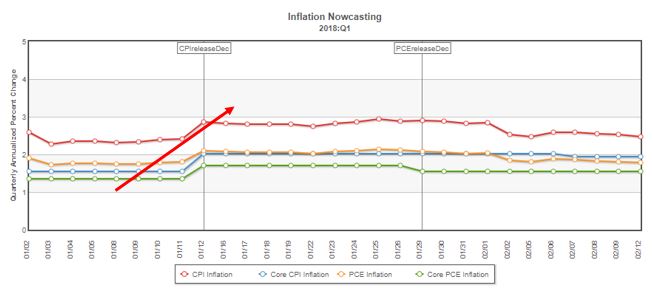
Third, inflation was also on the rise in 1987, similar to its anticipated rising now. [vii][viii]
Fourth, like then, portfolio insurance was the biggest culprit of the market crash in 1987. I know it’s hard to believe, but the concept of portfolio insurance was all the rave after a four-year long strong bull market in the 1980s. [ix]
Today, portfolio insurance goes by a different name; many know it as risk parity, but the concept is the same. The premise behind risk parity is to avoid large losses if the equity market corrects by investing in commodities, fixed income, and other non-correlated assets.
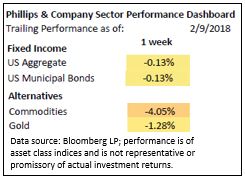
However, as you can see, these asset classes were also down last week when we needed them the most. In fact, look at the sharp declines in the Salient Risk Parity Index, which tracks risk parity as an asset class. [i]
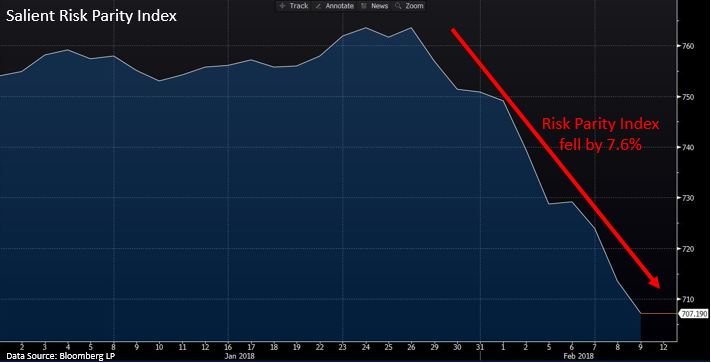
I’m no PhD in mathematics, but after more than thirty years of experience, I can tell you that when people panic, asset classes tend to correlate, similarly to the way they did last week, as evidenced by the non-correlated asset classes all declining alongside the overall market.
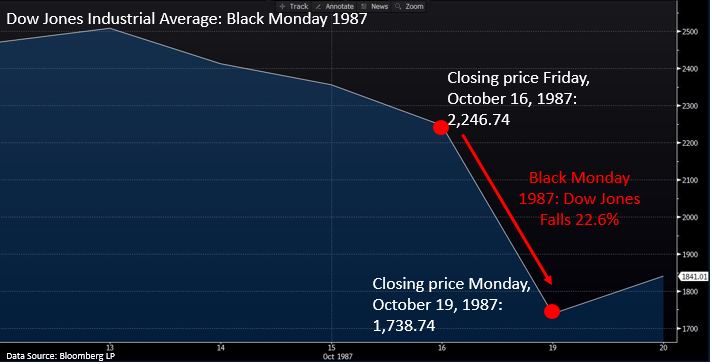
For those of you who don’t know, the unexpected market crash in 1987 was a massive drawdown in equity prices. In one single day, the Dow Jones Industrial Average declined 22.6 percent. [i]
I remember that day extremely well. My inexperience and lack of leadership at the firm level had all of us selling in a panic, only to realize the following:
- The world was not going to come to an end
- The newly appointed chair of the Federal Reserve, Alan Greenspan would in fact come to the rescue
- Markets move in very brief bursts, and recovery can happen much quicker than most realize
- Sometimes you shouldn’t listen to the old saying, “Don’t just stand there; do something!”
Although anything can happen with equity investing, and it usually does, it’s critical for me to reflect on the past. The one thing I would do differently is ensure every client clearly understands the time frame necessary when being exposed to equity investments.
In my opinion, investors should always have a rolling seven-year window in which to experience the ups and downs within their equity portfolio. In addition, it’s always crucial to have a clear plan on how your equity investments influence your overall financial plan and lifestyle needs. It does no good to take equity risk exposure unless you have a reasonably long-term investment horizon and your lifestyle would not be affected significantly by a maximum drawdown.
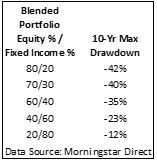
Many of the investors I speak with want to understand the intricacies of the maximum drawdown. Although there are many metrics and variations to choose from, we at Phillips & Company measure this by the amount in which a portfolio would decrease under the same circumstances as the previous global financial crisis. Here are some sample max drawdowns for blended portfolios. [x]
Although I don’t anticipate a 1987-like crash, I do know anything can happen. It’s critical to be sure that panic is not the tool of the trade, and we stick to good planning, transparency, and appropriate risk acceptance.
Panic is not a strategy. Trust me; I’ve tried, and it didn’t work.
If you have questions or comments, please let us know. You can contact us via Twitter and Facebook, or you can email Tim directly. For additional information, please visit our website.
Tim Phillips, CEO, Phillips & Company
Robert Dinelli, Investment Analyst, Phillips & Company
References:
i. Bloomberg LP
ii. https://fred.stlouisfed.org/series/FEDFUNDS
iii. https://www.reuters.com/article/us-usa-fed-mester/feds-mester-sees-three-or-four-rate-hikes-in-2018-and-2019-idUSKBN1F73AS
iv. http://www.businessinsider.com/fed-dot-plot-december-2017-12
v. http://www.multpl.com/s-p-500-earnings/table
vi. https://insight.factset.com/hubfs/Resources%20Section/Research%20Desk/Earnings%20Insight/EarningsInsight_020918.pdf
vii. http://www.inflation.eu/inflation-rates/united-states/historic-inflation/cpi-inflation-united-states-1987.aspx
viii. https://www.clevelandfed.org/our-research/indicators-and-data/inflation-nowcasting.aspx
ix. https://www.investopedia.com/ask/answers/042115/what-caused-black-monday-stock-market-crash-1987.asp
x. Morningstar Direct