Productivity Break Down/Up
There was a lot going on during the week with earnings season coming very close to an end and a big jobs report on Friday.
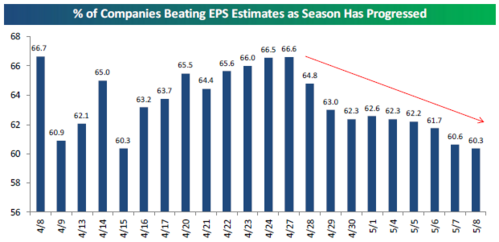
Earnings are weak and got weaker as the season progressed.[i]
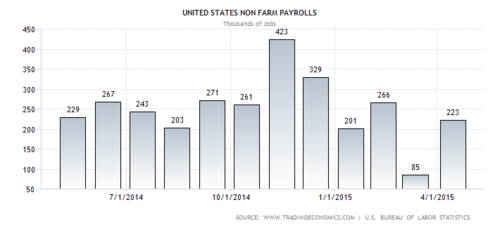
On the other hand, the job market heated up considerably in April from a revised, very soft March.[ii]
These major headlines overshadowed what I thought was a significant development on one economic front - the productivity of the US workforce.
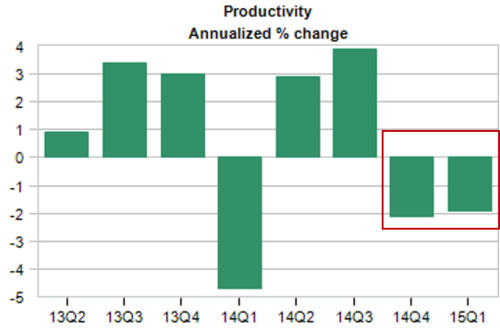
US productivity dropped again and this was the first back-to-back drop since before the Great Recession started.[iii]
Before we dive deeper into the number, it's important to know a few basic concepts when it comes to productivity. One would normally think strong productivity is good and weak productivity is bad. In general, that's the case, but while convenient, putting a good or bad label on productivity would be too simplistic.
First, productivity is a measure of output or total GDP in our economy divided by the total labor hours worked in the economy.
When productivity is going up, we are getting more from our workforce generally by using more technology, better manufacturing systems, or simply a better skilled workforce.
You can see when productivity rises (green trend line), we tend to have very low inflation (red trend line).[iv]
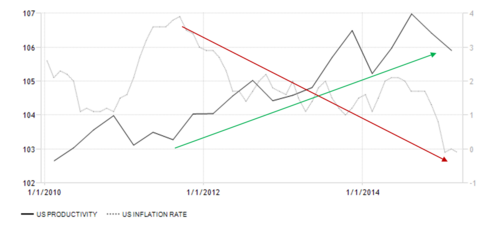
Why? Wages don't grow as fast. That keeps more earnings growth for companies and a little less earnings growth for the US consumer. Consumption does not explode as wages are suppressed.
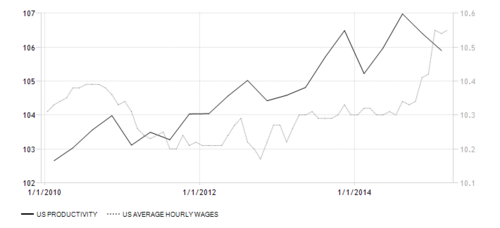
You can also see that from the data below comparing productivity to wages. Until recently, average hourly wages had little growth over the last 5 years while productivity gained.[v]
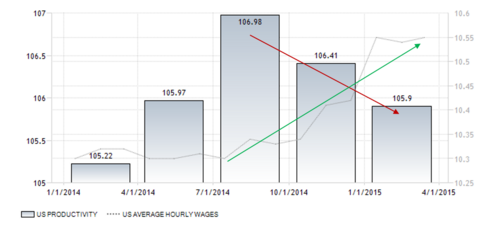
When productivity drops (red trend line) you get the opposite effect, more growth in wages (green trend line) and perhaps a little less growth in corporate earnings.[vi]
With that basic primer on productivity, let's examine a few trends from last week’s report.[iii]
- Nonfarm business compensation per hour increased 3.1% in Q1, its third consecutive quarterly increase.
- Nonfarm business unit labor costs rose 5.0% in Q1, following a 4.2% gain in Q4 2014.
Companies are raising pay to attract and retain employees as the job market tightens. My conclusion is there will be more dollars in the US consumer's pocket through wage growth and a little less profit in US corporate earnings at least in the short run.
Perhaps this earnings season was a small precursor to a momentary pause in the action for earnings. Don't fret for long as a healthier consumer making more money will ultimately lead to more profits for US businesses.
If you have questions or comments, please let us know as we always appreciate your feedback. You can get in touch with us via Twitter, Facebook, or you can email me directly. For additional information on this, please visit our website.
Tim Phillips, CEO – Phillips & Company
Jeff Paul, Senior Investment Analyst – Phillips & Company
References
[i] Bespoke Investment Group. (May 8, 2015). Just Right. The Bespoke Report. p 5.
[ii] TradingEconomics.com. (May 8, 2015). United States Nonfarm Payrolls.
[iii] Kelley, N. (May 6, 2015). United States: Productivity and Costs. Moody’s Analytics.
[iv] TradingEconomics.com. (May 8, 2015). United States Productivity and Inflation Rate.
[v] TradingEconomics.com. (May 8, 2015). United States Productivity and US Average Hourly Wages.
[vi] TradingEconomics.com. (May 8, 2015). United States Productivity and US Average Hourly Wages (2014-2015).