Rhetorical Calm Before the Political Storm
Jobs continue to dominate the headlines since Janet Yellen took control of the Federal Reserve. She has a legitimate dual mandate to improve the jobs picture by fostering "full-employment", estimated as longer-term unemployment in the range of 5.2% to 6.0%, and maintaining inflation at 2%.[i]
With most state political primary elections now in the rear view mirror, we will see the start of the political silly season. Traditionally, the party that controls the White House tends to lose seats in Congress during this mid-term election cycle. In other words, Democrats are going to be playing defense through November.
It's clear that one strategy that will be employed to move and motivate voters will be the income inequality issue. It's timely as there are still 1.08 million people unemployed above the median estimated Fed mandate of full employment, and a further 9.625 million underemployed that want full-time work.[ii]
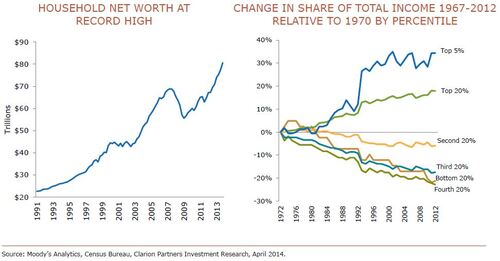
Since our economic power is almost solely based upon consumption, income inequality is a compelling issue to attack. While we are at record levels of household net worth, you can see there continue to be some significant shifts in the distribution of total income in the US.[iii]
As it relates to consumption, the following graphs show that the gap in share of personal consumption expenditures between the Top 20% and the Bottom 80% of earners has widened over the last decade.[iv]
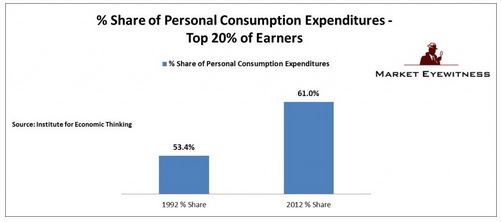
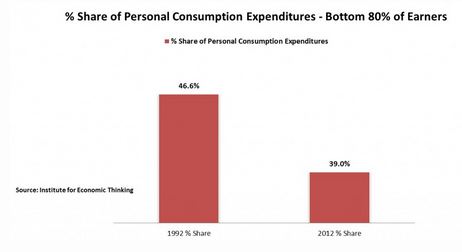
Those with higher income contributed a larger share of personal consumption in 2012 than in 1992, and those with lower income had a smaller share. You can bet there will be legitimate political debate and some illegitimate political points scored over the data presented above. The data certainly supports the "rich are getting richer" narrative that will be needed to buck the mid-term election trends.
However, from a different lens, income is not all that bad. Clearly one's perspective can easily be shaped by the data set being used.
The chart below shows modest and stable growth in average household incomes.[v] All income cohorts have experienced growth and that is good.
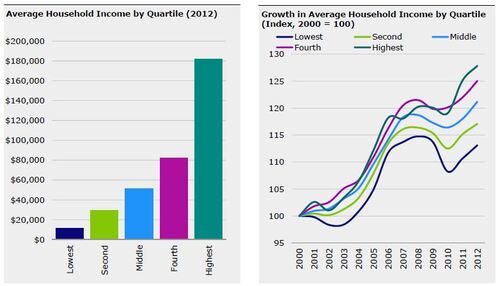
It's obvious that there are issues with income equality as it relates to share of total income, but income for all quartiles is growing albeit at different rates. If this weren't the case, we might experience some serious strains on our consumption obsession.
The differences in income growth among the quartiles is due in part to differences in the types of jobs being created and lost, and their wages. Since the Great Recession, the energy, tech, education and leisure/hospitality sectors have added a significant number of jobs, while manufacturing and construction have lost a significant number of jobs.[vi]

The real challenge is in the pay rates of the jobs that have been added and lost.[vii,viii]

For now, you can take a deep breath and enjoy the calm before the political storm erupts in the fall. Certainly, income inequality will be on the docket as a premier political football. Don't be fooled however, it's not as dire or sunny as either side will present. The bottom line is consumption will continue to dominate our economy as it's in our DNA to spend. The data clearly supports our ability to consume at some modest growth rate.
If you have questions or comments, please let us know as we always appreciate your feedback. You can get in touch with us via Twitter, Facebook, or you can email me directly. For additional information on this, please visit our website.
Tim Phillips, CEO – Phillips & Company
Jeff Paul, Senior Investment Analyst – Phillips & Company
[i] Federal Reserve Bank of Chicago. The Federal Reserve’s Dual Mandate.
[ii] Bureau of Labor Statistics. (May 2, 2014). The Employment Situation.
[iii] Clarion Partners (May 16, 2014). Market Outlook & House View. p. 25.
[iv] Waldron, A. (Mar 18, 2014). 6 Cold, Hard Facts about U.S. Economic Inequality. Market Eyewitness.
[v] Invesco. (May 2014). Higher Income Households Lead Income Recovery. p. 32.
[vi] Clarion Partners (May 16, 2014). Market Outlook & House View. p. 8.
[vii] Phillips & Company (May 5, 2014). Life Support. http://phillipsandco.com/blog/2014/5/5/life-support/
[viii] Bureau of Labor Statistics.