Testing Your Nerves
Testing Your Nerves
Weekly Market Commentary 6-17-13
Tim Phillips, CEO—Phillips & Company
Since the world misinterpreted the Federal Reserve Chairman's comments, we have seen a massive increase in volatility (also known as worry, anguish and second guessing by investors).
Volatility index
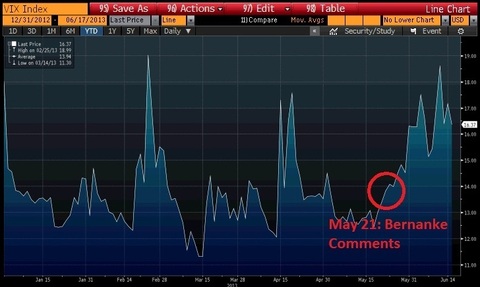
Prior to Bernanke’s comments, the Dow Jones moved 100+ points in a single day only 4 times since the beginning of the year[1]. Since his testimony, the Dow Jones has moved 100+ points 10 times—more than double the entire first part of 2013.[2]
I'm starting to see the worry within our clients and think it might be time to reaffirm some key concepts we have learned over many decades of collective experience at Phillips and Company.
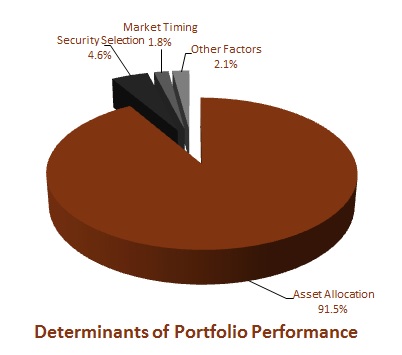
1) Your overall allocation, which is the amount you allocate to stocks and bonds, in addition to sector allocation (small cap, mid cap, etc.), determine most of your returns.[3]
2) To suggest anyone can predict exactly what will happen in markets, let alone individual securities, is a "trap for fools", to borrow from my favorite poet Rudyard Kipling.
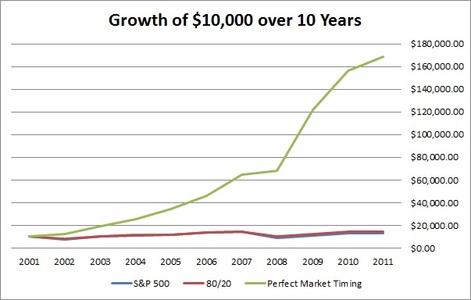
Phillips & Company did a case study on timing. If you were to time perfectly the buying and selling of asset classes over the last decade, you could take a small investment of $10,000 and turn it into $168,997. You can see below[1] that these returns are simply not realistic.
Seriously, do any of us believe someone would share with us their hidden gem of a tool to make money out of benevolence or a small fee, compared to what they can hoard for themselves? I especially love the online brokerage firms touting their special trading tools that can make you money. Really?
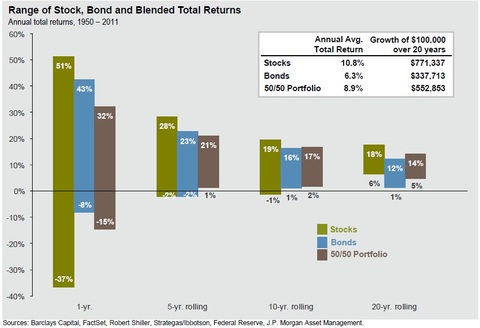
3) You can only shape the risks you take by using time. The longer time horizon you have for your investments, the less theoretical risk you take, as volatility can be smoothed out over time. Take a look at the chart below.[5]
The challenge is to adjust those allocations as you get close to drawing down your investments.
Why wealthy people get wealthier is in large part a matter of the time they allow their investments to work. They just don't need the money to maintain their daily living expenses or retirement. The reason good foundations and endowments grow is that they have structural controls on their spending and allow multiple generations to grow the assets, looking past volatility.
4) Investors need to overcome the Sleep Well, Live Well Paradox. Your spending rate, inflation, fees and the time you have in the market will determine most of your allocation.
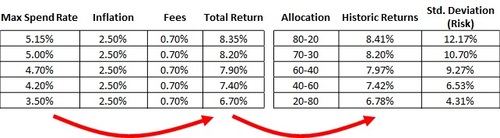
You can see from the table above[6] if you spend about 5% of your assets a year like most foundations, you will need to generate at least 8.20% returns to keep up with inflation and fees. A 70-30 allocation has historically produced these returns over the past 20 years, although a one-standard deviation event could cause returns to swing up or down by 10.70% in a given year.
Now, you’re talking about living with more volatility or losing some sleep. If you don't like the volatility, you will have to spend less.
I hope these rules of thumb can help as they guide us daily. We have many more but perhaps these will calm nerves, stir a debate on your investment committee or dinner table about your timeframe, return requirements or simple ability to hold on. We certainly hope that we can engage you in this conversation with your financial advisor in the near future.
If you have questions or comments, please let us know as we always appreciate your feedback. You can get in touch with us via Twitter, Facebook, or you can email me directly. For additional information on this, please visit our website.
Tim Phillips, CEO – Phillips & Company
Alex Cook, Investment Analyst – Phillips & Company
[1] “Recent Swings…”, Wall Street Journal, June 17, 2013
[2] Ibid.
[3] “Determinants of Portfolio Performance II: an Update” by B.G.P. Brinson, B.D. Singer and G.L. Beebower.Financial Analysts Journal, May-June, 1991. Results are based on the 10-year performance record of 91 pension funds.
[4] Historic returns from Bloomberg and JP Morgan Asset Management.
[5] Image source: “4Q 2012 Guide to the Markets”, JP Morgan
[6] Data source: Morningstar Direct. Return and volatility data are historic 20 year figures as of May 31, 2013. Maximum spending rate is calculated as historic returns, minus fees and inflation. Fees and inflation figures are for illustrative purposes only and may not be reflective of actual account fees or actual levels of inflation. The S&P 500 is used as a proxy for stocks, and the Barclays Aggregate Bond Index is used as a proxy for bonds.