Trade policy is back in the headlines.
The Supreme Court has weighed in on executive tariff authority. President Trump has announced a proposal for a new 15% tariff. Average statutory tariff rates have already moved higher. The trade deficit just printed one of the largest readings since 1960.
If you only read the headlines, you might assume inflation is about to surge again.
The data tells a more nuanced story.
Tariffs Have Already Moved Meaningfully Higher
1 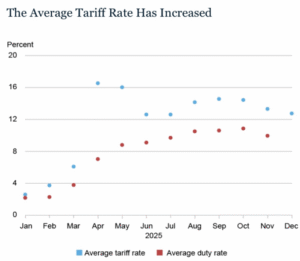
Average tariff rates rose materially throughout 2025. Even after exemptions and reclassifications, effective duty rates remain elevated relative to pre‑trade‑war norms. The cost structure of global trade has changed.
And yet we have not seen a proportionate explosion in goods inflation. Perhaps it’s because of the shift in global supply chains.
China’s Share Is Falling — But Imports Are Not
2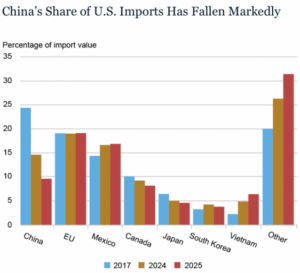
China’s share of U.S. imports has dropped below 10%, while Mexico, Vietnam, and other regions have gained ground. That is not the collapse of global trade; it’s the rerouting of global trade. When tariffs increase friction in one channel, supply chains adjust. Firms re‑source, diversify, and optimize around policy rather than surrender to it.
3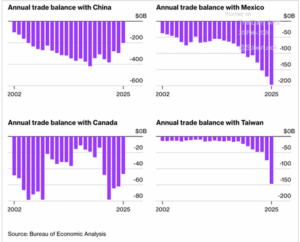
The Trade Deficit Remains Historically Large
4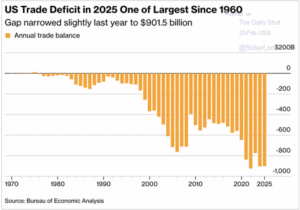
Despite higher tariffs and shifting supply chains, the overall U.S. trade deficit remains historically large.
Bilateral deficits widened in places like Mexico and Taiwan, even as China’s share declined. Tariffs did not suppress imports. They redirected them.
A large trade deficit is often a sign of strong domestic demand. Americans are still buying. Businesses are still investing. Capital goods and intermediate inputs continue to flow in. That is growth with friction.
What the Supreme Court Ruling Changes
The Supreme Court’s ruling on executive tariff authority introduces uncertainty into how trade policy may be implemented going forward. Policy stability affects capital allocation. Trade clarity affects long‑term investment decisions. Volatility raises risk premia.
But it does not automatically reverse existing tariffs. Nor does it unwind supply chain shifts already underway. The 15% announcement raises the temperature. Whether it materially changes effective duty rates remains to be seen.
Growth Under Friction
5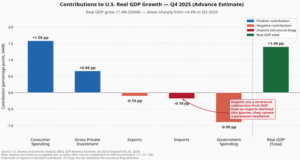
Consumer spending remains positive. Gross private investment remains positive. Imports subtract mechanically from GDP accounting, but that subtraction reflects demand. (The big economic drag was the collapse of government spending with the shut down.)
Imports are not weakness in isolation. They are an accounting reality of a consumption‑driven economy.
The Longer Game: Productivity
6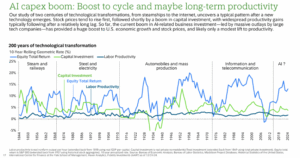
Historically, technological waves follow a pattern. Markets respond first. Capital investment accelerates next. Productivity gains follow with a lag. When trade friction rises, firms either absorb costs or invest to eliminate them.
We are already seeing the second response.
If tariffs increase operational complexity, companies automate, digitize, and compress supply chains. AI, robotics, and software become tools to neutralize trade friction. Friction often accelerates innovation.
Consumption Is Still Backed by Income, but Wealth Counts A Lot
7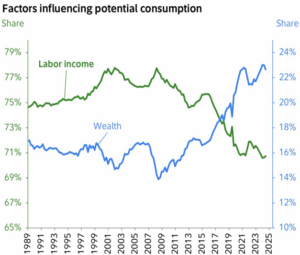
Labor income remains a large driver of consumption. As long as employment and productivity remain firm, the economy can absorb higher trade costs better than many expect. A bigger force for consumption is now wealth, in houses and stocks.
The real risk is not tariffs alone; it is tariffs without productivity.
Tariffs are higher. Trade flows are shifting. The Supreme Court has added policy complexity. The 15% announcement raises the stakes.
Yet the economy continues to expand. Investment continues. Consumption continues. The system is not breaking. It is adapting.
The real question is whether this period of trade friction ultimately slows growth — or accelerates the productivity investments that offset it.
History suggests that when pressure rises, innovation follows. The next 12–24 months will determine whether tariffs become a structural drag — or a catalyst for capital deepening.
That distinction matters far more than the headlines— and that is what we should be watching.
If you have questions or comments, please let us know. You can contact us via X and Facebook, or you can e-mail Tim directly. For additional information, please visit our website.
Tim Phillips, CEO, Phillips & Company
Sources:
- “Average tariff rates and duty rates chart: Federal Reserve Bank of New York, Liberty Street Economics (U.S. Census Bureau, USITC tariff data).”
- “China’s share of U.S. imports: Federal Reserve Bank of New York, Liberty Street Economics (U.S. Census Bureau).”
- “U.S. trade deficit data: Bureau of Economic Analysis, Daily Shot / SoberLook visualization.”
- “GDP contributions: Bureau of Economic Analysis, Q4 2025 Advance Estimate.”
- “Tariff / immigration GDP effects: Goldman Sachs Global Investment Research.”
- “AI CapEx and productivity history: TS Lombard 200-year technological transformation study.”
- “Consumption drivers: Fed / central bank wealth vs labor income analysis.”
Notes: Phases represent historical market behavior across prior cycles; durations approximate.
The charts and data presented are sourced from a combination of public domain materials and licensed data providers. Their use is intended solely for educational and analytical commentary and falls within the scope of fair use. For a representative list of sources, please click here.
The material contained within (including any attachments or links) is for educational purposes only and is not intended to be relied upon as a forecast, research, or investment advice, nor should it be considered as a recommendation, offer, or solicitation for the purchase or sale of any security, or to adopt a specific investment strategy. The information contained herein is obtained from sources believed to be reliable, but its accuracy or completeness is not guaranteed. All opinions expressed are subject to change without notice. Investment decisions should be made based on an investor’s objective.