In the summer of 1987, the U.S. Navy launched Operation Earnest Will, escorting oil tankers through the Strait of Hormuz during the Iran-Iraq War.
At the time the global economy depended on that narrow passage more than most people realized. Roughly one-fifth of the world’s oil supply flowed through the strait each day. Tankers were being attacked, mines were appearing in shipping lanes, and energy markets were on edge.
The U.S. mission was straightforward but incredibly delicate: keep the corridor open and the global economy supplied. History rarely repeats exactly, but it often rhymes.
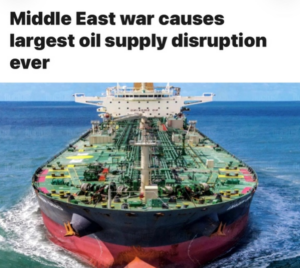
Nearly forty years later, the Strait of Hormuz once again sits at the center of geopolitical tension. The risk of a long shutdown is dominating headlines (and forcing me to continue to help assess the impact for our clients and friends).
Oil traders understand this instinctively, because when supply routes tighten, energy prices react almost at once. And when energy prices rise, consumers notice.
The United States is far more energy independent today than it was during the 1970s or even the early 2000s. Domestic production has reshaped the equation dramatically. But oil is still priced in global markets, and when geopolitical tensions ripple through those markets, American households still feel it.
Policymakers likely understood the geopolitical risks involved in this latest military development. These decisions are extraordinarily complex, and the men and women serving our country deserve our deepest respect and gratitude. However, markets rarely analyze intentions. They analyze consequences.
And one of the first consequences of instability around the Strait of Hormuz is usually higher gas prices.
The Inflation Billboard
Energy prices have an outsized influence on how consumers feel about the economy. Not because they are the largest expense, but because they are the most visible. Gasoline prices are one of the few economic statistics Americans see displayed in six-foot-tall numbers on street corners every day. Economists sometimes refer to it as the “inflation billboard.”
When gas prices rise, people feel poorer — even if their income hasn’t changed. And that psychological effect can ripple across the entire economy.
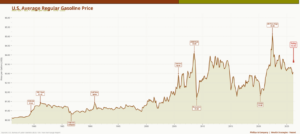
U.S. Average Regular Gasoline Price (1976–2026)
Looking across the long history of gasoline prices reveals a familiar pattern.
The spikes are rarely random. They tend to coincide with geopolitical events or supply shocks:
- The 1979 Iranian Revolution
- The 1990 Gulf War
- The 2009 Commodity Supercycle
- The 2022 Russia-Ukraine energy shock
Each surge in energy prices created stress for households and anxiety for markets. And yet, each episode also eventually passed.
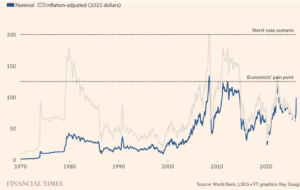
Yet the real, or inflation adjusted, gas price today is far below the pain thresholds of the past. The economic pain point (light gray line), as noted by the Financial Times, is much higher than the current price; implying the U.S. gas consumer can bear more price increases compared to historic standards adjusted for inflation.
Meanwhile, the American Consumer Keeps Going
While headlines focus on geopolitical risk, the underlying strength of the U.S. consumer often receives less attention.
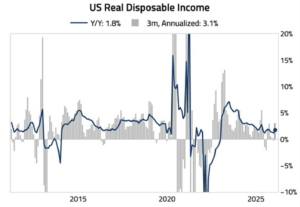
In the latest reading, income growth continues to charge ahead with little sign of abatement.
Real disposable income is currently growing roughly 1.8% year-over-year, with a stronger 3% annualized pace over the past three months.
That may not sound dramatic, but income growth is the backbone of consumption — and consumption drives roughly 70% of the U.S. economy.
More interesting than the overall number is how consumers are spending.
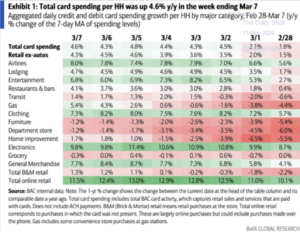
Bank of America’s aggregated card data shows total spending up 4.6% year-over-year.
Interestingly, consumer spending didn’t slow after the geopolitical headlines intensified. In fact, Bank of America’s card data shows total spending accelerating from 1.8% growth to 4.6% in just one week, led by travel, entertainment, electronics, clothing, and restaurant spending. The American consumer may feel anxious — but they are still very much participating in the economy.
The Sentiment Paradox
This brings us to one of the more fascinating paradoxes in economics. Consumers often feel pessimistic about the economy even when their financial behavior suggests resilience.
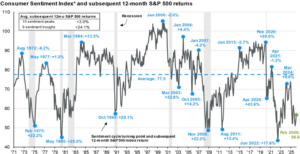
This chart compares the University of Michigan Consumer Sentiment Index with the subsequent 12-month returns of the S&P 500. And the relationship is striking.
Historically:
Average return after sentiment peaks → +3.9%
Average return after sentiment troughs → +24.1%
In other words, the stock market has historically produced some of its strongest returns when consumer sentiment was near its lowest levels. Today’s readings sit in that weaker range historically. While sentiment could decline further, it is already on the pessimistic side of the historical spectrum.
Sentiment tends to collapse during moments of economic stress — recessions, inflation spikes, or energy shocks. And those moments are often when markets have already priced in much of the fear.
The Consumer Today
Today’s consumer sits at the intersection of several competing forces.
On one hand, income is still rising, employment remains strong, and spending growth continues. On the other hand, geopolitical risk remains elevated, energy prices are rising, and sentiment remains fragile.
This tension between economic resilience and psychological caution may be one of the defining features of the current cycle.
Consumers feel uneasy — yet they continue to participate in the economy.
Gasoline prices move quickly, and consumer sentiment often moves even faster. In many ways, the real race may be between rising energy prices and consumer sentiment. That dynamic may persist only as long as consumers are able to absorb higher energy costs. Just as quickly as sentiment can deteriorate, it can also rebound. If tensions ease and shipping lanes reopen, energy markets could stabilize.
Historically, moments of peak anxiety — especially those tied to energy shocks — have often been when opportunity quietly begins to take shape.
If you have questions or comments, please let us know. You can contact us via X and Facebook, or you can e-mail Tim directly. For additional information, please visit our website.
Tim Phillips, CEO, Phillips & Company
Sources:
International Energy Agency. Oil Market Report. March 2026.
The Irish Times. “Middle East war creating ‘largest supply disruption in the history of oil markets,’ says IEA.” March 12, 2026.
U.S. Energy Information Administration (EIA). U.S. Average Regular Gasoline Prices. Data series accessed March 2026.
U.S. Bureau of Economic Analysis (BEA). Real Disposable Personal Income. Updated February 2026.
Bank of America Institute. Consumer Checkpoint / Credit & Debit Card Spending Tracker. March 7, 2026.
University of Michigan. Surveys of Consumers – Consumer Sentiment Index. February 2026 release.
Standard & Poor’s / Bloomberg. S&P 500 Historical Return Data. Data accessed March 2026.
Associated Press / Getty Images. Strait of Hormuz tanker traffic and oil shipping photographs. Published March 2026.
The charts and data presented are sourced from a combination of public domain materials and licensed data providers. Their use is intended solely for educational and analytical commentary and falls within the scope of fair use. For a representative list of sources, please click here.
The material contained within (including any attachments or links) is for educational purposes only and is not intended to be relied upon as a forecast, research, or investment advice, nor should it be considered as a recommendation, offer, or solicitation for the purchase or sale of any security, or to adopt a specific investment strategy. The information contained herein is obtained from sources believed to be reliable, but its accuracy or completeness is not guaranteed. All opinions expressed are subject to change without notice. Investment decisions should be made based on an investor’s objective.