This week, let’s start with this chart. It might help describe what I believe is a shift in employment vs. an overall weakness in jobs.
When you step back and watch employment over time, the labor market rarely breaks in a straight line. It shifts. Different parts of the economy take turns doing the heavy lifting, and during those transitions the headline number can still look steady even as the mix underneath it changes.
That is what this looks like right now.
The top line is holding. People are working. Payrolls are growing as we added 178k jobs in March. If you only looked at that, you would say the labor market is in good shape, and I think that is right.1
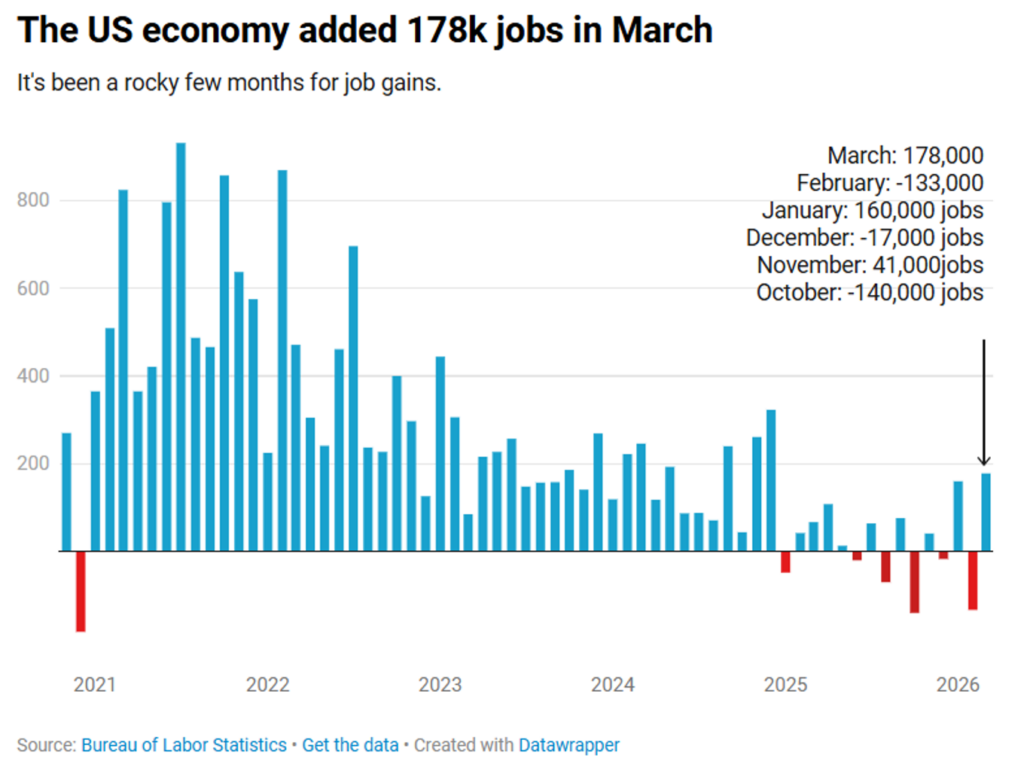
What has changed is not the level of employment, but where the growth is coming from.1
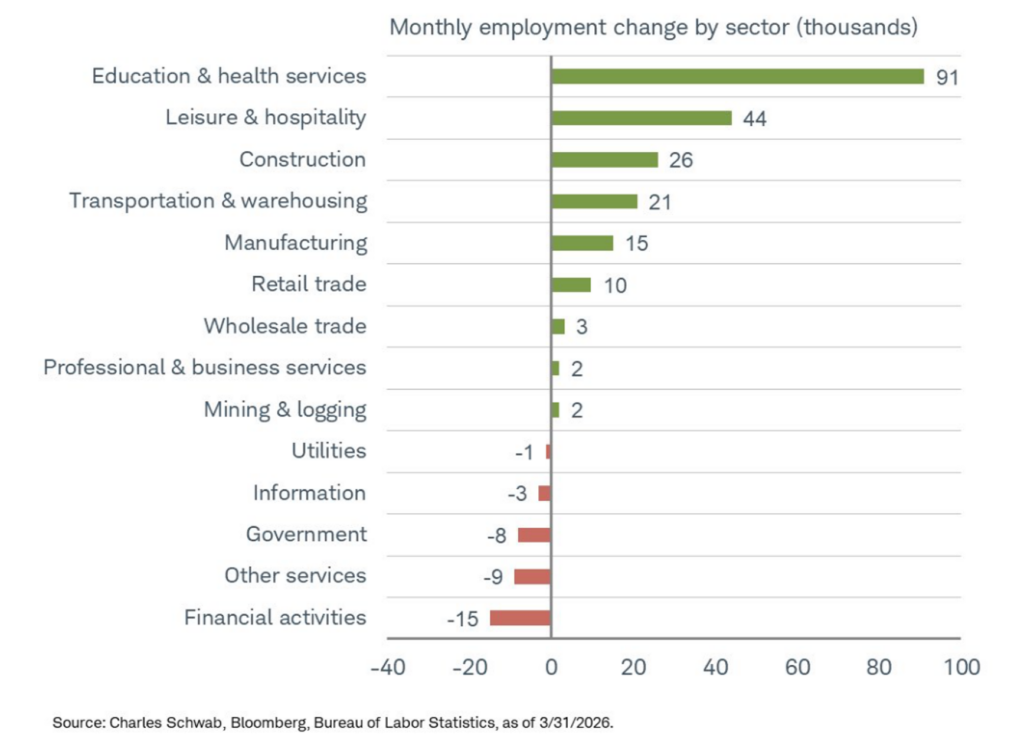
If you break down the most recent report, two areas continue to show up in a consistent way: healthcare and education, and leisure and hospitality.
They have been adding jobs month after month, and they are doing a meaningful share of the work right now. These are large parts of the economy, tied closely to demographics and consumer behavior, and they tend to be steady. This has been a 10-year trend.
That is what I mean when I refer to a “vacation and get sick” economy.
It is a simple way of describing where demand is actually showing up. People are still traveling, still going out, and at some point, interacting with the healthcare system. Those are not one-time bursts of hiring. They are persistent sources of jobs, and they are carrying more of the load today.
Outside of those areas, the picture is a little more mixed, but still constructive.
Construction, manufacturing, and transportation are running below their longer-term trend. That stands out, but they are still adding jobs. Activity is still there, but the pace has just eased. 2
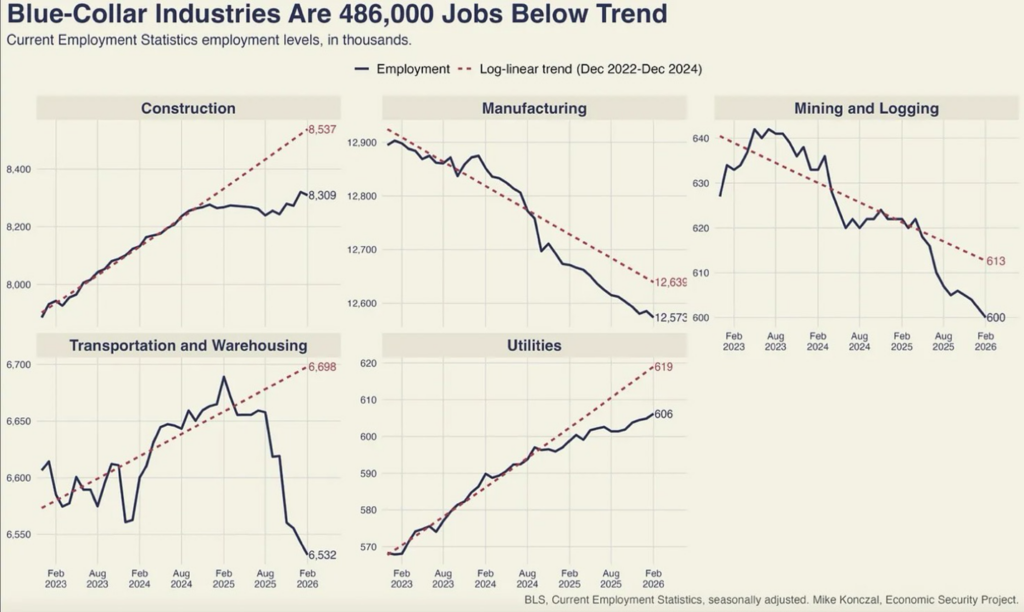
After a strong period, it is not unusual for these sectors to settle down a bit. They tend to move earlier in the cycle, so some moderation here is consistent with an economy that is still moving forward, just not accelerating.
You can feel the handoff happening rather than a drop-off.
The tech sector adds another layer to this shift.3
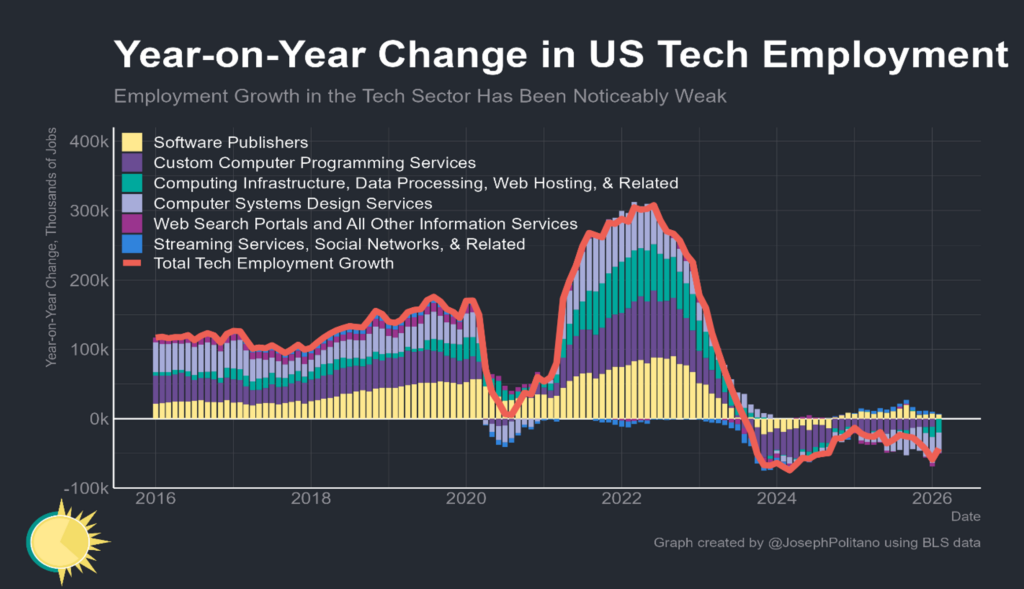
Hiring has slowed, and in some areas it has moved lower. The information technology sector is a prime example.
AI is improving productivity inside these companies. The same firms building these tools are using them to operate more efficiently. Work that used to require larger teams can now be handled with fewer people. The sector is laying off employees driven by their own technological gains.
So, the sector is still growing, but it is translating into job losses and that too has been a multi-year trend.
Over time, those productivity gains tend to show up elsewhere. New businesses get formed, costs come down, and different types of jobs emerge, not to mention extraordinary earnings growth within the companies. It just does not happen all at once.
Government employment has been trending lower, which removes one of the steadier contributors to job growth.3
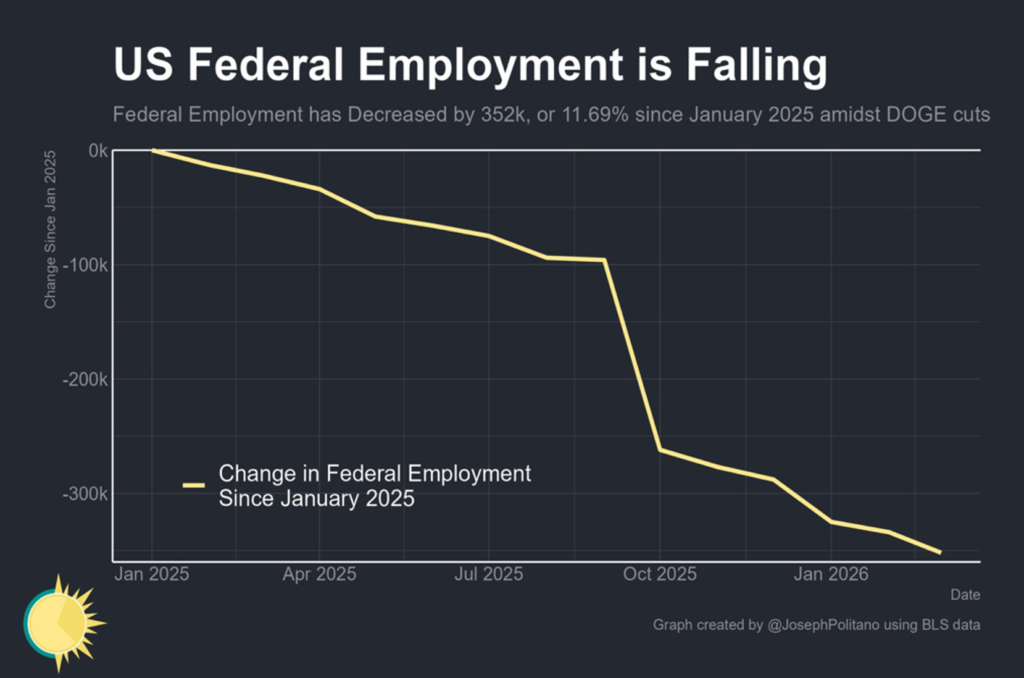
That is noticeable, but it reflects policy choices more than economic stress. The private sector is still doing most of the work.
Looking back, these kinds of shifts have happened before, and it rarely feels comfortable while you are in it.
In the late 1990s, there was a period where manufacturing employment started to cool after decades of being a core part of the job market. Factories were becoming more efficient, supply chains were expanding globally, and fewer workers were needed to produce the same output.
If you were sitting in the Midwest at the time, that shift felt very real. Towns built around manufacturing started to see hiring slow down and it was easy to look at that and assume it would spill over into the broader economy.
At the same time, something else was happening that was less obvious.
Healthcare employment was growing steadily as the population aged. Service jobs were expanding as incomes rose and spending shifted. And a new category, technology and internet-related jobs, was starting to build momentum in places like California, Texas, and parts of the Northeast.
None of those areas, on their own, replaced manufacturing. But together, they did.
By the time you got to the early 2000s, the economy had absorbed that shift. The mix of jobs looked different, but overall employment continued to grow, and the expansion carried on longer than many expected.
There were large groups of people left behind and that was unfortunate, but the system adjusted. That’s why I’m optimistic this shift in employment will propel our growth and perpetuate our ongoing consumption economy.
One thing to keep in mind is what the economy needs in terms of jobs to keep chugging.
This is where the breakeven concept helps tie everything together.4
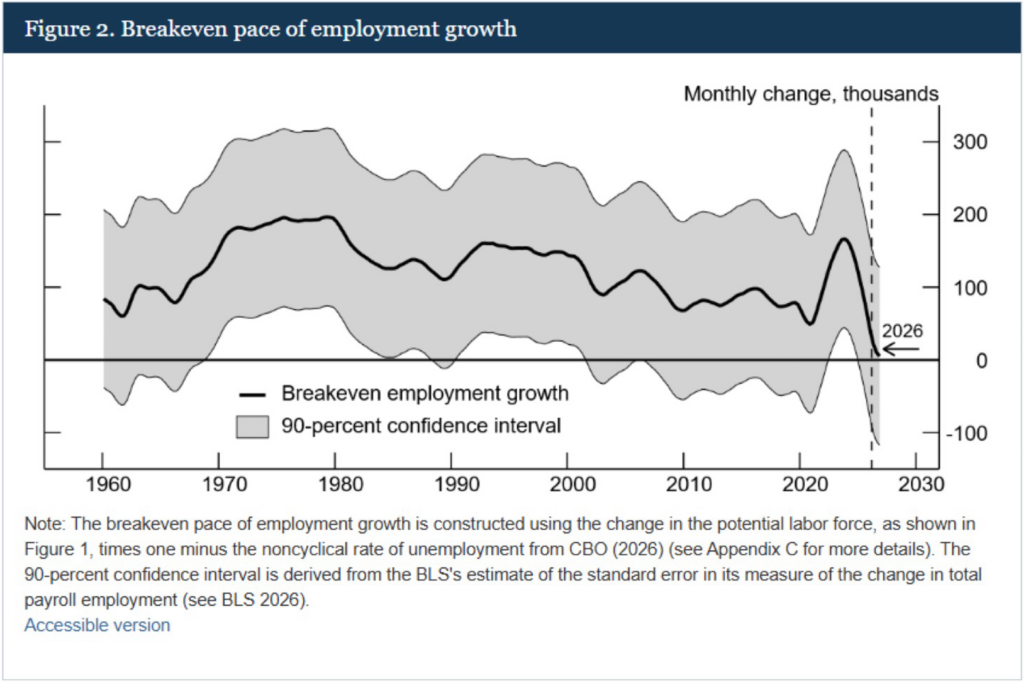
There is a level of job growth the economy needs just to stay even with population and labor force trends. That level has been moving lower over time. A shrinking pace of immigration, along with productivity enhancements, is part of this story. Job growth now needs to be at near zero to keep our unemployment rate steady.
What that means is the economy does not need the same number of new jobs to remain stable. A smaller gain can still support steady employment and income growth.
When you combine that with the current mix of job creation, it helps explain why the labor market can feel solid even as leadership shifts across sectors. We are still adding enough jobs to stay comfortably above that line.
The labor market today is in good shape. Some sectors are moving at a slower pace. Technology is becoming more efficient with how it uses labor. The mix of job growth looks different than it did a few years ago.
And when you step back and look at it through that lens, it looks less like a labor market losing strength and more like one that is rotating, with enough stability at its core to keep things moving forward—as long as people continue to need healthcare and want to enjoy their lives.
If you have questions or comments, please let us know. You can contact us via X and Facebook, or you can e-mail Tim directly. For additional information, please visit our website.
Tim Phillips, CEO, Phillips & Company
Sources:
- U.S. Bureau of Labor Statistics (BLS) Current Employment Statistics, with sector-level analysis and charting from Charles Schwab and Bloomberg (March 2026)
- Blue-collar employment trends from BLS and the Economic Security Project (Mike Konczal)
- Technology and federal employment data from BLS with visualization by Joseph Politano (Apricitas Economics)
- Breakeven employment growth estimates from the Congressional Budget Office (CBO, 2026) incorporating BLS labor force data.
The charts and data presented are sourced from a combination of public domain materials and licensed data providers. Their use is intended solely for educational and analytical commentary and falls within the scope of fair use. For a representative list of sources, please click here.
The material contained within (including any attachments or links) is for educational purposes only and is not intended to be relied upon as a forecast, research, or investment advice, nor should it be considered as a recommendation, offer, or solicitation for the purchase or sale of any security, or to adopt a specific investment strategy. The information contained herein is obtained from sources believed to be reliable, but its accuracy or completeness is not guaranteed. All opinions expressed are subject to change without notice. Investment decisions should be made based on an investor’s objective.