There is a quiet truth about investing that never changes:
Risk is always present. It doesn’t disappear when inflation cools. It doesn’t vanish when earnings beat estimates. It doesn’t take a vacation because markets have had a strong run.
It simply rotates.
And if you’ve been doing this as long as I have, you learn that the discomfort investors feel today is not evidence that something is broken. It’s evidence that markets are functioning normally.
The Inflation Backdrop Is Cooling — But Not Gone
1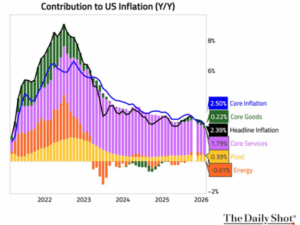
Consumer prices have clearly rolled over from the 2022 peak. The 12-month number has been grinding lower. The shorter-term three- and six-month measures are showing moderation.
That’s constructive.
But notice what the chart really shows: inflation doesn’t move in a straight line. It pulses—accelerating, cooling, flaring, and settling.
Markets are digesting a cooling inflation environment, not a perfectly stable one.
That distinction matters.
Cooling inflation reduces pressure on margins, supports real income growth, and gives the Fed flexibility. But it doesn’t eliminate volatility. It just shifts the conversation.
Earnings: Strong Q4, Slight Trim to Q1
Q4 earnings came in strong. Growth was broad-based, particularly in technology and industrials. The S&P 500 overall delivered double-digit growth. That’s real and tangible.
2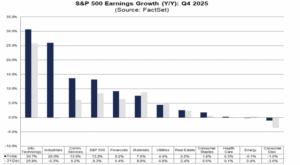
But markets don’t trade on what happened last quarter. They trade on what might happen next quarter.
Estimates for Q1 2026 have been nudged slightly lower. Not collapsing. Not recessionary. Just trimmed.
3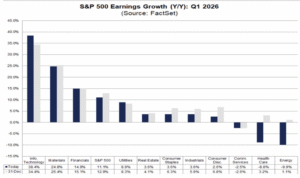
Technology remains a leadership engine. But we’re seeing small adjustments across sectors. Energy softens. Health care lags. Some cyclicals cool a bit.
That’s not a crisis, just normalization over a reasonable period of time. After periods of strong earnings acceleration, expectations tend to recalibrate. It’s part of the rhythm of a cycle.
Every Year Has a Drawdown
Since 1980, the average intra-year decline has been about 14%.
Fourteen percent.
4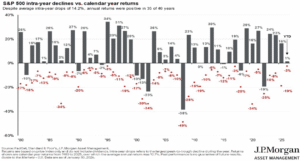
And yet, the majority of those years still finished positive.
Markets routinely fall 10–15% during the year. It feels uncomfortable every time. Headlines amplify it. Narratives form quickly.
But historically, it’s the norm. Drawdowns are not the exception. They are the cost of compounding.
Breadth, Rotation, and Being Off Highs
Many industry groups are meaningfully off their 52-week highs. Some double digits. Some even more. In fact, most groups are well off their 52-week highs.
That doesn’t automatically mean recession, yet it might generate investor fear and angst.
5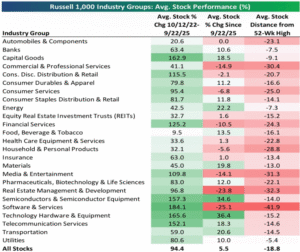
It means rotation. It means repricing. It means markets are constantly re-evaluating risk and growth assumptions.
When “everything feels in a drawdown,” what’s often happening is dispersion. Capital moves. Leadership changes. Volatility clusters. This is not new. It just feels new when we’re living inside it.
The Equity Cycle
6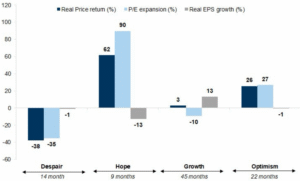
Every equity cycle has phases:
Despair, Hope, Growth, and Optimism
We are somewhere in the middle stages.
Risk!
Risk is the price of admission.
Risk is not something we eliminate.
It is something we manage.
When inflation was surging, that was risk.
When earnings were peaking, that was risk.
When estimates get trimmed slightly, that is also risk.
The form changes. The presence does not.
If you demand zero volatility, you will eventually own zero growth.
If you understand that a 10–15% intra-year decline is statistically normal, you stop treating normal volatility as a crisis.
That’s where long-term compounding lives.
So What Does This Mean For You?
– Inflation is cooling — constructive but not risk-free.
– Q4 earnings were strong — supportive backdrop.
– Q1 estimates have been slightly revised — normal cycle digestion.
– Industry groups are off highs — rotation, not necessarily recession.
– Intra-year drawdowns are typical — not predictive of annual outcomes.
The market is doing what markets have always done.
It is pricing risk.
Our job is not to react emotionally to that process.
It is to navigate it thoughtfully.
As I’ve said before: earnings are like gravity. Over time, they matter more than headlines.
Risk never leaves.
But disciplined investors learn to live with it — and benefit from it.
If you have questions or comments, please let us know. You can contact us via X and Facebook, or you can e-mail Tim directly. For additional information, please visit our website.
Tim Phillips, CEO, Phillips & Company
Sources:
- Core CPI (3-, 6-, and 12-Month Annualized Changes)
Source: U.S. Department of Labor, Bureau of Labor Statistics (BLS)
Data: Core Consumer Price Index for All Urban Consumers (CPI-U), seasonally adjusted
Notes: Three- and six-month figures are annualized from monthly data. - S&P 500 Earnings Growth (Year-over-Year) – Q4 2025
Source: FactSet, Earnings Insight Report
Data: S&P 500 blended earnings growth rate by sector
Notes: “Current” figures reflect the most recently reported and estimated results. - S&P 500 Earnings Growth (Year-over-Year) – Q1 2026
Source: FactSet, Earnings Insight Report
Data: Forward earnings growth estimates by sector
Notes: Estimates are subject to revision as the reporting season progresses. - S&P 500 Intra-Year Declines vs. Calendar Year Returns (1980–2025)
Source: J.P. Morgan Asset Management, Guide to the Markets
Data: Standard & Poor’s, FactSet, J.P. Morgan Asset Management calculations
Notes: Intra-year decline represents the largest peak-to-trough decline within each calendar year. - Russell 1000 Industry Groups – Average Stock Performance & Distance from 52-Week High
Source: FactSet
Index: Russell 1000 Index
Data: Industry group performance, average change since October 12, 2022, and distance from 52-week highs. - Market Cycle Decomposition (Despair → Hope → Growth → Optimism)
Source: Historical market phase analysis
Data: Standard & Poor’s; Robert Shiller data series; FactSet
Methodology: Decomposition based on S&P 500 real price return, P/E multiple expansion, and real EPS growth.
Notes: Phases represent historical market behavior across prior cycles; durations approximate.
The charts and data presented are sourced from a combination of public domain materials and licensed data providers. Their use is intended solely for educational and analytical commentary and falls within the scope of fair use. For a representative list of sources, please click here.
The material contained within (including any attachments or links) is for educational purposes only and is not intended to be relied upon as a forecast, research, or investment advice, nor should it be considered as a recommendation, offer, or solicitation for the purchase or sale of any security, or to adopt a specific investment strategy. The information contained herein is obtained from sources believed to be reliable, but its accuracy or completeness is not guaranteed. All opinions expressed are subject to change without notice. Investment decisions should be made based on an investor’s objective.