We are currently witnessing a fascinating bit of economic gymnastics.
Consumer sentiment has risen for the second month in a row, even as the personal savings rate has slipped to roughly 3.5%, a level that would normally set off alarms. At first glance, this looks like the American consumer doing what they always do at the end of a cycle: spend first, worry later.
But this time, it feels a little different.
It’s not that households suddenly feel richer. It’s that the pressure has eased. The people raising prices have finally taken a breather.
Feeling Better Without Getting Richer
Real income growth is clearly moderating. The data shows that consumer spending has been running ahead of real disposable income growth for some time, a dynamic that is mathematically unsustainable over long periods.
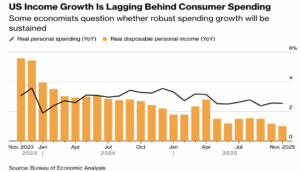
Under normal circumstances, this gap would crush confidence. Yet sentiment is improving.
Why?
Because inflation—particularly expected inflation—has cooled. When households believe prices will rise more slowly tomorrow, today’s paycheck suddenly feels more usable, even if it isn’t growing much faster.
That’s relief! And relief matters more than economists often admit.
We’re feeling better not because we’re richer, but because the environment feels less hostile.
The Savings Rate as a Confidence Signal
A falling savings rate is usually framed as financial fragility. Sometimes that’s fair. But it can also signal something subtler: reduced precautionary behavior.
When inflation expectations fall, households don’t feel the same urgency to hoard cash “just in case.” They’re more willing to spend out of current income—even if income growth itself is cooling.
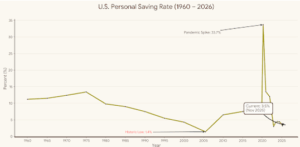
In that context, today’s lower savings rate looks less like desperation and more like tentative confidence. Just a cautious willingness to exhale after a long period of economic stress.
Housing: The Quiet Stabilizer
One reason this confidence has a floor is housing.
Despite higher interest rates, home prices have held up far better than many expected, and for most households, housing remains the single largest source of perceived wealth.
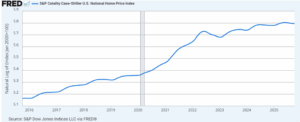
You don’t need to refinance or tap equity to feel better. You just need to believe the value is still there, and it is.
Inflation Expectations: The Emotional Engine
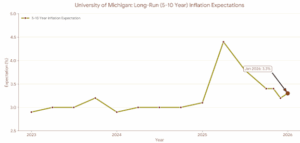
Short-term inflation expectations have eased, and longer-term expectations remain anchored. That combination is powerful.
1-Year Expectations
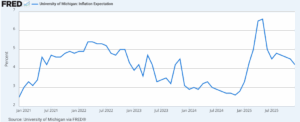
5-10 Year Expectations
A Historical Aside (And Why This Matters for Portfolios)
After World War II, Americans saved aggressively—not because they were pessimistic, but because rationing had taught them restraint. As shortages eased and prices stabilized, savings fell even though incomes didn’t surge overnight.
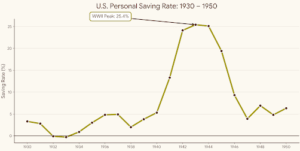
People didn’t suddenly become reckless. They became comfortable.
The lesson wasn’t about wealth. It was about certainty.
Today’s 3.5% savings rate feels similar. Consumers aren’t signaling abundance; they’re signaling a small level of confidence that they can spend as their core savings, their home, is worth something more today than it was in years past.
That kind of confidence can extend an economic cycle. But it’s also fragile.
If you have questions or comments, please let us know. You can contact us via X and Facebook, or you can e-mail Tim directly. For additional information, please visit our website.
Tim Phillips, CEO, Phillips & Company
Sources:
Sources & Data Notes (latest available data as of January 2026)
Personal Saving Rate: U.S. Bureau of Economic Analysis (BEA), via Federal Reserve Bank of St. Louis (FRED), Personal Saving Rate (PSAVERT). Latest observation: November 2025 (released January 22, 2026). Real Personal Consumption Expenditures and Real Disposable Personal Income: BEA, via FRED, PCEC96 and DSPIC96. Latest observation: November 2025 (released January 22, 2026). Home Prices: S&P CoreLogic Case-Shiller National Home Price Index, via FRED (CSUSHPISA, seasonally adjusted). Latest observation: October 2025 (released December 30, 2025). Consumer Sentiment and Inflation Expectations: University of Michigan Surveys of Consumers. Latest observation: January 2026 final release (January 23, 2026), including 1-year and 5-to-10-year inflation expectations.
The charts and data presented are sourced from a combination of public domain materials and licensed data providers. Their use is intended solely for educational and analytical commentary and falls within the scope of fair use. For a representative list of sources, please click here.
The material contained within (including any attachments or links) is for educational purposes only and is not intended to be relied upon as a forecast, research, or investment advice, nor should it be considered as a recommendation, offer, or solicitation for the purchase or sale of any security, or to adopt a specific investment strategy. The information contained herein is obtained from sources believed to be reliable, but its accuracy or completeness is not guaranteed. All opinions expressed are subject to change without notice. Investment decisions should be made based on an investor’s objective.