Last week’s market wobble had a familiar feel. A big headline. A sharp selloff. A collective inhale. This time, the trigger was capital expenditures.
1.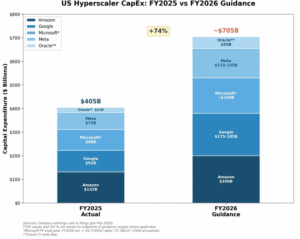
Amazon, Google, Microsoft, Meta, Oracle—together guiding toward roughly $700 billion of U.S. hyperscaler CapEx in 2026—spooked investors who suddenly worried that spending had gotten ahead of returns. Stocks sold off. Commentators dusted off phrases like “overbuild,” “margin pressure,” and “AI bubble.”
It all felt dramatic. And to be fair, markets are allowed to be dramatic in the short run. But step back a bit, and the story looks far less ominous—and far more constructive.
Amazon led the way with an increase in cap ex that was hard to quantify if you are just reading the headline. However, if you just look a little below the headline, the CEO, Andy Jassy, couldn’t have been more precise.
Andy Jassy’s comments were widely quoted but selectively absorbed. His point wasn’t that Amazon is guessing. It was the opposite.
2.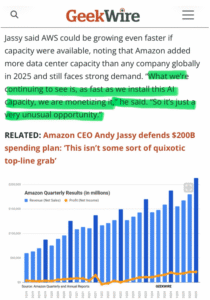
“As fast as Amazon installs AI capacity, it’s being monetized.” Demand isn’t theoretical. It’s constrained by how quickly infrastructure can be brought online. That’s capacity chasing revenue.
Capital expenditures by companies are not just about capital allocation by the giant players but also a direct driver of macroeconomic growth.
Using historical multipliers, $700 billion in data-center CapEx translates into roughly 0.9–1.1 percentage points of GDP growth at peak impact. Even excluding imported inputs, domestic GDP lift approaches 0.4–0.5 points.
4.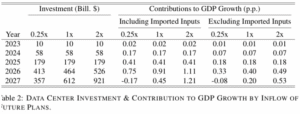
That’s meaningful in an economy growing 2–2.5%. That could be a 50% bump in growth to an economy that is pushing north of $ 30 trillion in output.
I’ll now connect the dots to the consumer so we understand how infrastructure build-out by the big tech players can connect to the consumer.
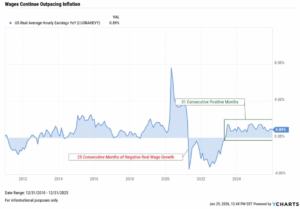
Capital spending flows outward—into construction jobs, equipment, chips, power, and logistics. Those dollars become wages. And wages become spending. Real wages are now positive again and have remained so for over two years.
5.
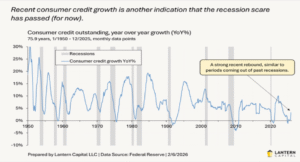
At the same time, consumer credit growth has re-accelerated—historically a sign of confidence, not distress.
6.
Let’s circle back to the profit motive driving companies to spend so aggressively to meet near-term demand. Take Google, for example—a large player in search and in AI, both of which require significant data storage and data transmission.
7.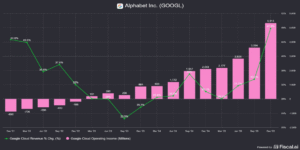
Google Cloud provides a clean example. Revenue growth remains solid, but operating income has inflected sharply higher. Margins are expanding. AI investment is improving unit economics. This is CapEx buying operating leverage.
Markets struggle when timelines stretch beyond a quarter. Big capital cycles always look uncomfortable in the middle. Historically, the returns show up after the doubt.
Think of AI CapEx like a subplot in a movie. For example, the movie Moneyball, where the point isn’t playing baseball—it’s understanding what creates wins.
Freeze the frame and it looks ordinary. Watch the whole film and you realize it’s fuel—keeping the engine running long enough for the story to unfold. The mistake is judging the subplot instead of the whole story.
Capital investment is accelerating. GDP impact is real. Consumers are spending. Wages are growing. AI is already producing profit leverage.
Transitions always look messiest before they look obvious.
If you have questions or comments, please let us know. You can contact us via X and Facebook, or you can e-mail Tim directly. For additional information, please visit our website.
Tim Phillips, CEO, Phillips & Company
Sources:
- Company Earnings Calls and Filings (Jan–Feb 2026)
Amazon, Alphabet (Google), Microsoft, Meta, Oracle
FY2025 actual capital expenditures and FY2026 guidance as discussed in recent earnings calls and investor presentations. - Amazon.com, Inc.
Quarterly and annual financial reports; public comments from CEO Andy Jassy regarding AWS demand, AI capacity buildout, and monetization trends.
Source: Amazon Investor Relations; reporting via GeekWire. - Alphabet Inc. (Google)
Google Cloud revenue growth and operating income data.
Source: Alphabet earnings releases; Fiscal.ai aggregation. - U.S. Data Center Investment & GDP Contribution Study
Analysis of data center capital investment and its contribution to U.S. GDP growth under varying investment inflow assumptions, including and excluding imported inputs.
Source: Academic and policy research summarized in “Data Center Investment & Contribution to GDP Growth by Inflow of Future Plans.” - U.S. Bureau of Labor Statistics (BLS)
Real Average Hourly Earnings (inflation-adjusted), year-over-year.
Source: BLS; visualization via YCharts. - Federal Reserve (Board of Governors)
Consumer credit outstanding, year-over-year growth.
Source: Federal Reserve Statistical Releases (G.19); visualization via Lantern Capital. - YCharts / Fiscal.ai / Lantern Capital
Charting platforms used for visualization of wage growth, consumer credit trends, hyperscaler capital expenditures, and cloud profitability metrics
The charts and data presented are sourced from a combination of public domain materials and licensed data providers. Their use is intended solely for educational and analytical commentary and falls within the scope of fair use. For a representative list of sources, please click here.
The material contained within (including any attachments or links) is for educational purposes only and is not intended to be relied upon as a forecast, research, or investment advice, nor should it be considered as a recommendation, offer, or solicitation for the purchase or sale of any security, or to adopt a specific investment strategy. The information contained herein is obtained from sources believed to be reliable, but its accuracy or completeness is not guaranteed. All opinions expressed are subject to change without notice. Investment decisions should be made based on an investor’s objective.