On March 28, Egypt announced something that would have sounded strange a few years ago but feels perfectly rational in an energy squeeze1. The government said it would slow some fuel-intensive state projects for at least two months, cut fuel allocations for government vehicles by 30%, and move both public- and private-sector employees to remote work on Sundays through April, excluding essential services and manufacturing. That came less than two years after Egypt had already been wrestling with summer power shortages severe enough that officials were publicly announcing the end of load-shedding once gas shipments arrived. In other words, this was not an abstract policy exercise. It was a reminder that when energy gets tight enough, countries do not respond with theories. They respond with behavior.
Big economic stories often begin with something small and practical. A family drives less. A business cuts travel. A government sends people home on Sundays. The adjustment does not begin with a spreadsheet. It begins with people reacting to a higher bill and trying to make the math work.
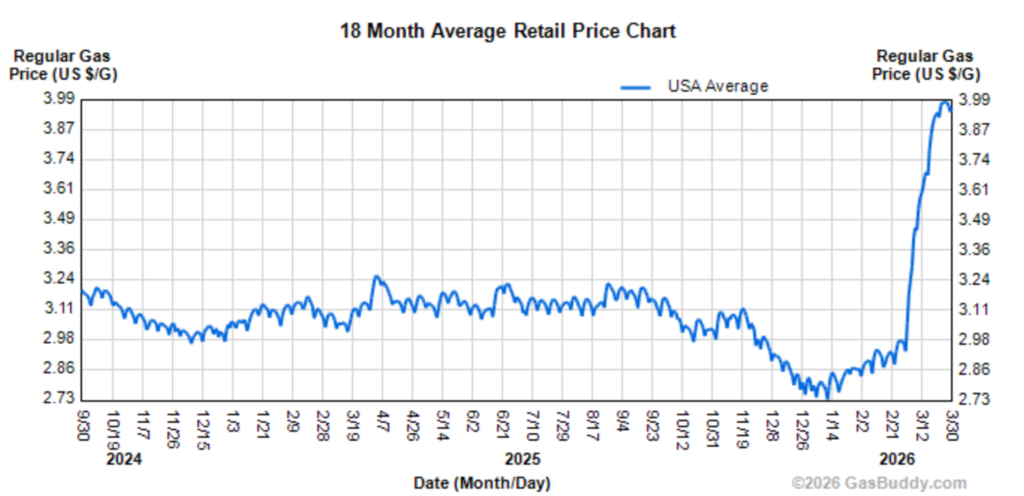
That is why the recent jump in gas prices matters. It is visible, immediate, and easy to understand. The national average has moved from roughly the high-$2s earlier this year to about $3.99 a gallon by late March2. That kind of move gets attention because it is one of the few prices consumers see in bold print every week. It is also one of the few prices that can change sentiment before it changes spending.
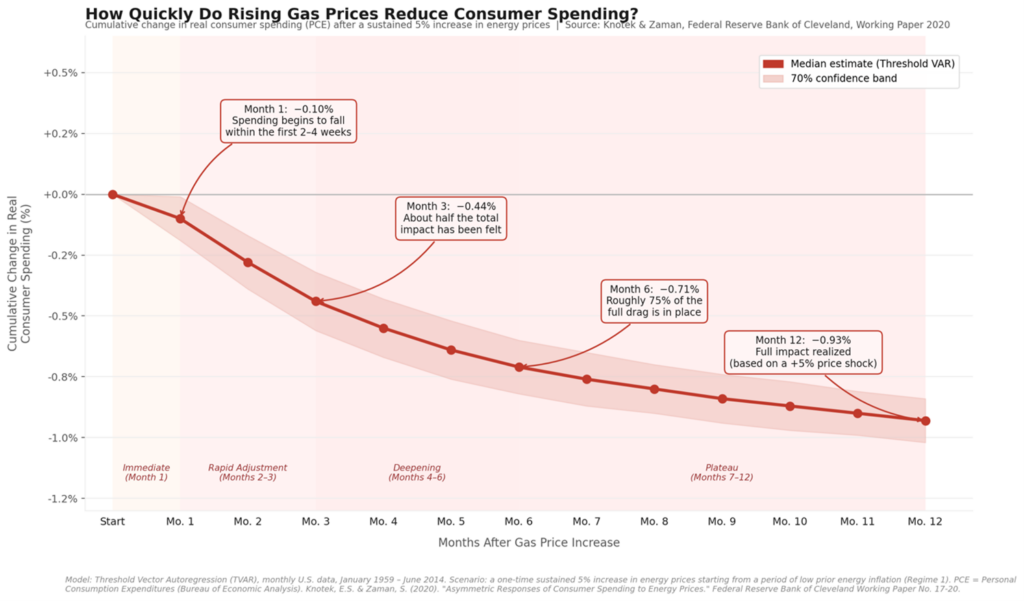
The standard story is straightforward enough. Higher gas prices act like a tax. Over time, more of the household budget goes to energy and less is available for other things. Cleveland Fed research shows that after a sustained 5% increase in energy prices, the hit to real consumer spending is modest at first, then builds over time: about -0.10% after one month, roughly -0.44% by month three, around -0.71% by month six, and close to -0.93% by month twelve3. That is a useful reminder that the damage from energy shocks usually arrives gradually, not all at once.
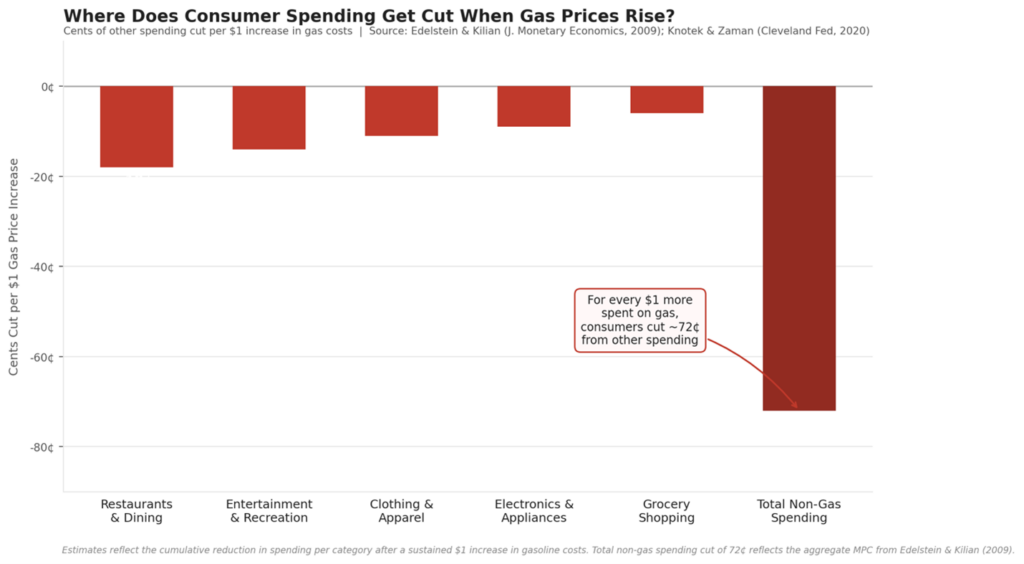
Consumers do not absorb a gas shock in one place—the cutbacks spread. The academic work from the same Fed study suggests that for every additional $1 spent on gasoline, other spending declines by roughly 72 cents in aggregate, with restaurants, recreation, apparel, electronics, and even grocery shopping all taking some share of the hit4. That is a meaningful drag and helps explain why energy spikes can feel larger than their direct weight in the CPI basket.
But this is where I think the usual market conversation becomes too narrow. Gas prices matter. They matter to sentiment, they matter to household cash flow, and they matter to some categories of spending more than others. Still, I do not think gas is the main story here. I think it is the more visible story.
The more important shock is interest rates.
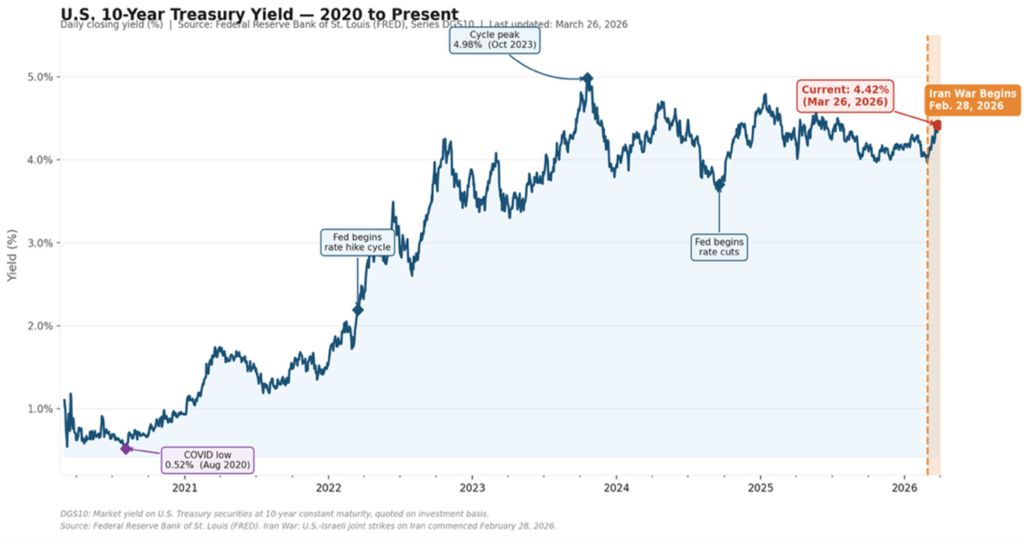
The 10-year Treasury yield was 4.42% on March 26, according to FRED5. That is below the 4.98% cycle peak in October 2023, but it is still a very high level relative to the world investors got used to in the decade before inflation returned. The point is not that yields are making new highs. The point is that the price of capital remains meaningfully elevated. That affects mortgage rates, refinancing math, project hurdle rates, valuation multiples, and the general willingness of businesses and households to take risk. A gas shock shows up at the pump. A rate shock shows up almost everywhere.
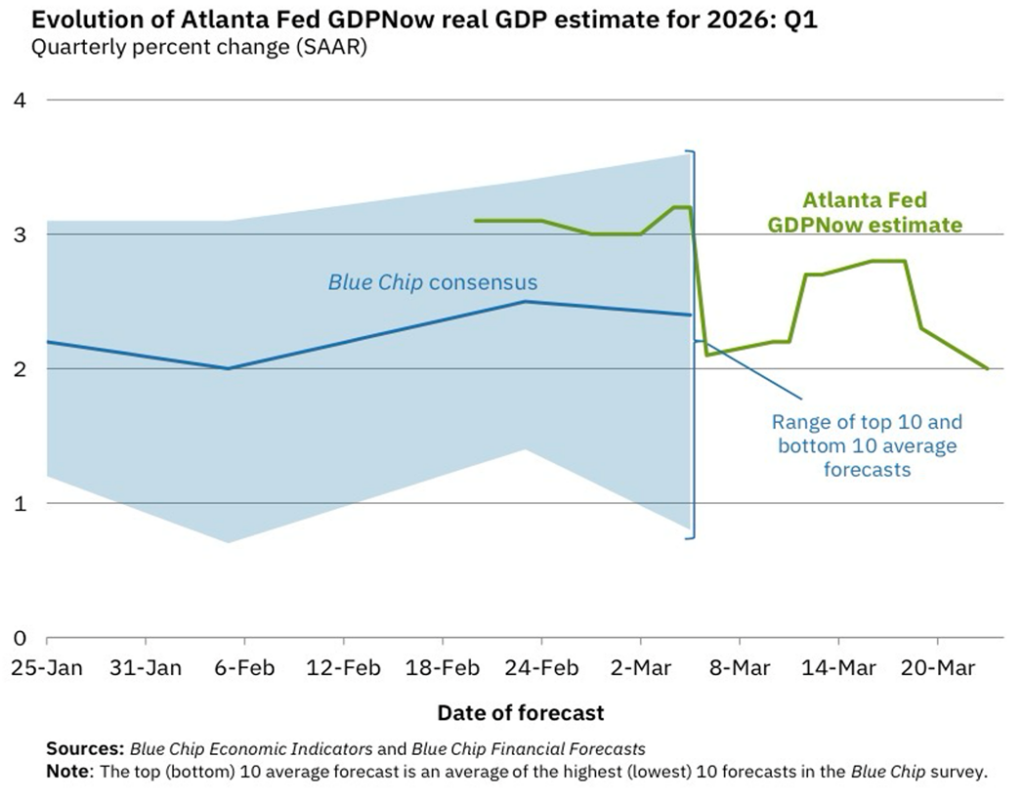
That is also why I would be careful about reading too much into the current GDP tracking estimates. The Atlanta Fed’s GDPNow estimate for Q1 2026 was 2.0% as of March 236, and the Atlanta Fed is explicit that GDPNow is a mechanical nowcast based on incoming data, with no subjective adjustments layered in. In plain English, it does not attempt to anticipate how a late-quarter energy spike, a geopolitical shock, or a change in consumer psychology might ripple through spending behavior before the hard data fully arrives. It simply processes what is already in the data.
That matters because the consumption hit from energy prices is not just delayed. It is also filtered through expectations.
If consumers believe a price shock is permanent, they adjust more aggressively. If they think it is temporary, they tend to smooth through it for a while. That distinction matters a great deal today. I suspect a meaningful share of households and businesses still believe this war-related energy spike will fade and that gasoline prices will normalize once the conflict cools. If that expectation is right, then the drag on consumption could be less severe and less durable than the historical averages might suggest. If it is wrong, then the lagged spending effects become more important as we move through the next few months.
This is one reason not to overstate the gas story, even though it is real. The United States is not Egypt. We are not moving the economy to remote work to save fuel. And more importantly, American consumption is increasingly influenced by something that is less intuitive than wage income alone.
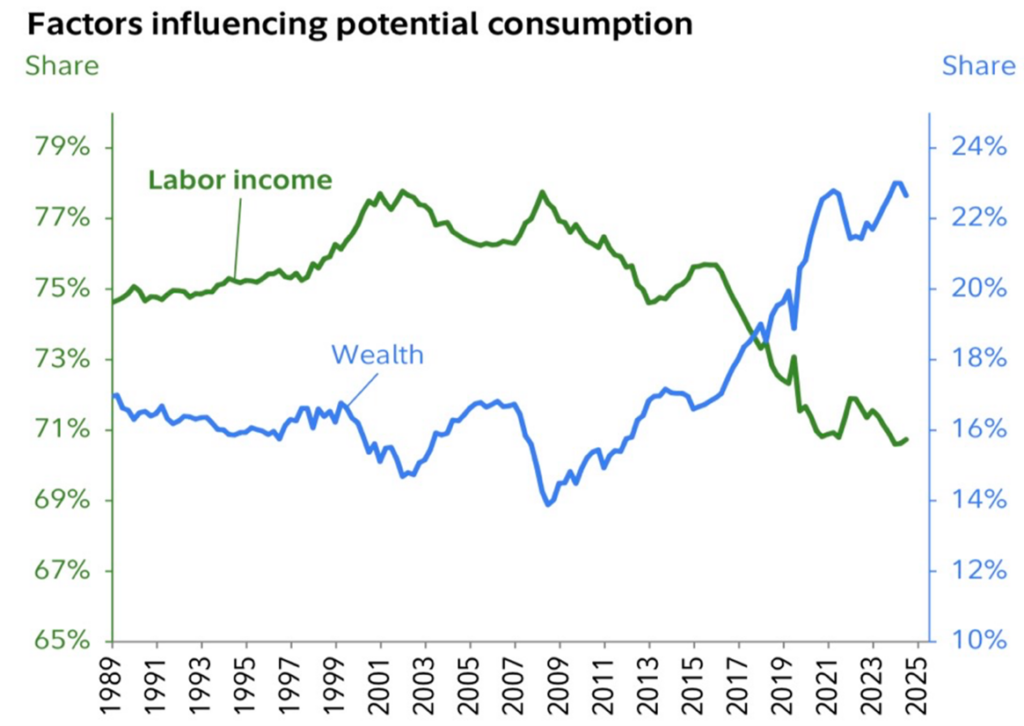
It is influenced by wealth.
Over time, labor income still matters, but the wealth effect has become much larger. When household balance sheets feel strong, people spend differently. When retirement accounts, brokerage accounts, and home values rise, consumers often behave with more confidence than they would if they were living strictly off current cash flow. That does not mean gas prices do not hurt. It means the transmission mechanism runs through a broader system than the weekly fill-up. In this country, consumption is increasingly tied to the market value of accumulated assets7.
That is why, if I had to keep my eye on one thing here, it would not be the pump. It would be earnings.
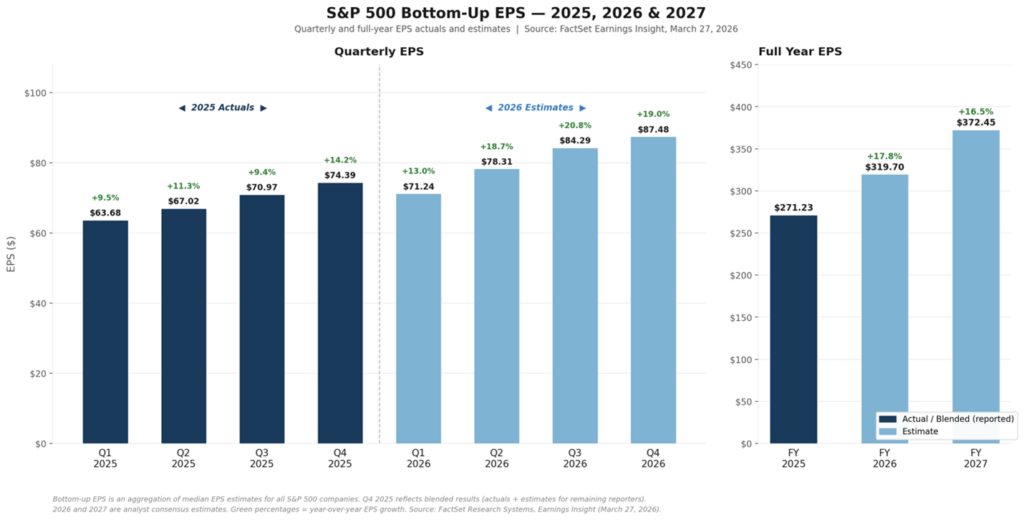
FactSet’s March 27 Earnings Insight still shows a fairly constructive earnings backdrop, with bottom-up S&P 500 EPS estimates of 17.8% growth for 2026 and 16.5% for 20278. These are estimates, not guarantees, and they can change quickly. But the broader point stands: earnings drive equity prices, equity prices drive wealth, and wealth now plays a meaningful role in supporting consumption. If that earnings story holds together, then the economy has a cushion that does not show up in a simple gasoline-shock framework. If the earnings story weakens, then the wealth effect can reverse and the consumption picture becomes more fragile in a hurry.
That is the proper hierarchy. Gas prices are the headline. Interest rates are the persistent pressure. Earnings are the bridge between the financial markets and the real economy. This trifecta—gas pieces, interest rates and earnings—drives volatility.
One of the easiest mistakes investors make is to say they want the long-term compounding of equities but are surprised when the path includes drawdowns. It is like wanting to own beachfront property but being offended by the salty air.
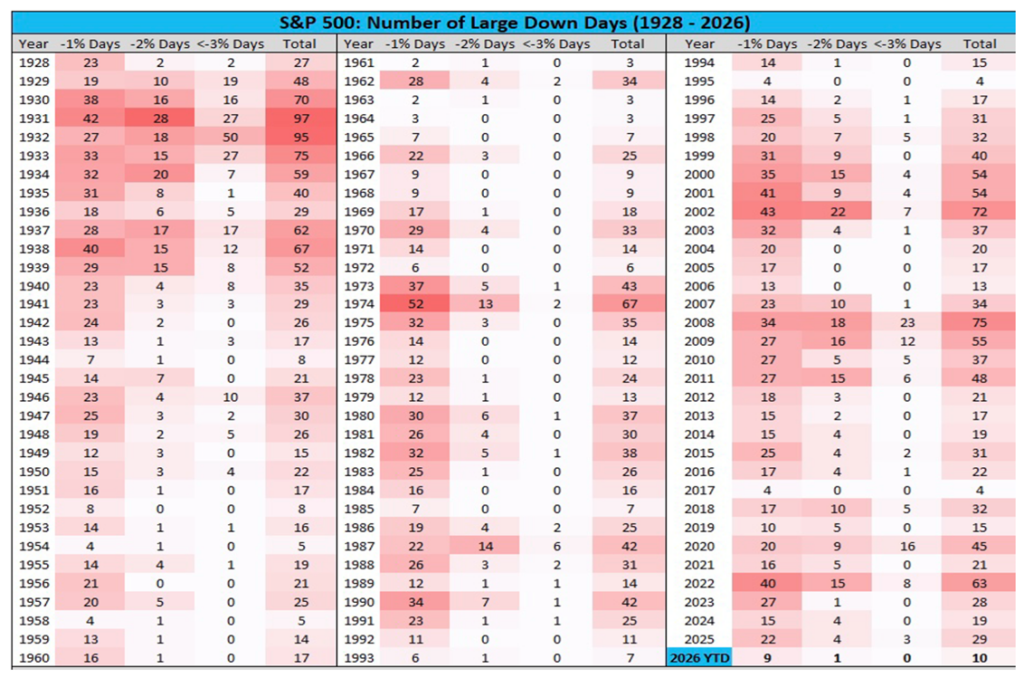
In 2022, the S&P 500 had 63 days down more than 1%, including 15 down more than 2% and 8 down more than 3%. In 2025, there were 29 days down more than 1%. Even in 2026 year-to-date, there have already been 10 days down more than 1% and one day down more than 2%9. That is not evidence that something has gone wrong. It is evidence that ownership comes with movement.
If we are right that wealth has become a bigger driver of consumption, then we also have to accept the flip side of that argument: the path to building wealth will always feel bumpier than investors would prefer. Markets do not hand out compounding in smooth monthly increments. They hand it out unevenly, with interruptions, second guesses, and periodic spells where the headlines feel much worse than the underlying economic trend.
So yes, elevated gas prices matter. They will bite at the margin, and the bite tends to deepen over time. But I would still lean more heavily on the interest-rate story than the gas-price story, and even more heavily on the earnings story than either of them. An end to the current conflict could help restore spending and normalize interest rates. In the end, if earnings remain intact, equity values may be supported, and if equity values hold, the consumption side of the economy could prove more resilient than the simple gas-price narrative suggests.
That does not remove volatility. It simply reminds us what volatility is. It is not a flaw in the system, but the price of admission.
If you have questions or comments, please let us know. You can contact us via X and Facebook, or you can e-mail Tim directly. For additional information, please visit our website.
Tim Phillips, CEO, Phillips & Company
Sources:
- Reuters, March 28, 2026, Egypt energy conservation measures.
- GasBuddy, U.S. Regular Gasoline Retail Prices (18-month average) through March 2026
- Federal Reserve Bank of Cleveland (Knotek & Zaman, 2020) and Edelstein & Kilian (2009), consumer response to energy price shocks
- Federal Reserve Bank of Cleveland (Knotek & Zaman, 2020) and Edelstein & Kilian (2009), consumer response to energy price shocks
- Federal Reserve Bank of St. Louis (FRED), 10-Year Treasury Yield (DGS10) data through March 26, 2026
- Federal Reserve Bank of Atlanta, GDPNow Q1 2026 estimate (March 2026)
- BEA and Federal Reserve data on labor income and household wealth
- FactSet Earnings Insight, March 27, 2026, S&P 500 EPS estimates for 2025–2027
- S&P Dow Jones Indices, historical distribution of S&P 500 down days (1928–2026)
The charts and data presented are sourced from a combination of public domain materials and licensed data providers. Their use is intended solely for educational and analytical commentary and falls within the scope of fair use. For a representative list of sources, please click here.
The material contained within (including any attachments or links) is for educational purposes only and is not intended to be relied upon as a forecast, research, or investment advice, nor should it be considered as a recommendation, offer, or solicitation for the purchase or sale of any security, or to adopt a specific investment strategy. The information contained herein is obtained from sources believed to be reliable, but its accuracy or completeness is not guaranteed. All opinions expressed are subject to change without notice. Investment decisions should be made based on an investor’s objective.