In October of 1973, Americans lined up at gas stations across the country. It wasn’t because oil had disappeared overnight. It was because geopolitics suddenly collided with economics in a very visible way.
The Yom Kippur War triggered an Arab oil embargo, and the United States — heavily reliant on Middle Eastern supply — discovered how quickly global tension could filter into daily life. Oil prices quadrupled. Inflation surged. Confidence cracked. Markets didn’t simply decline; they began repricing an entirely new economic reality.
At the time, it felt structural. Permanent. Like the world had shifted in a way that would not easily reverse.
But history has a longer memory than markets do in the moment. The embargo ended. Supply chains adjusted. Energy production diversified. Markets adapted. Investors who stayed disciplined through that turbulence were ultimately rewarded over time — though the path was anything but smooth.
Volatility is not a flaw in markets. It is part of the cost of participating — and it can be uncomfortable along the way.
Last week carried a similar tension — not identical, but familiar.
Mortgage rates dipped below 6% for the first time in months, a development that could gradually ease housing lock-in and support transaction activity. Inflation momentum continues to soften at the margin. At the same time, consumer delinquencies are creeping higher. The Citrini letter adds uncertainty around AI direction. And geopolitical risk has returned to the forefront with escalating tension involving Iran and renewed concerns around the Strait of Hormuz following U.S. and Israeli strikes.
The Strait of Hormuz handles roughly one-fifth of the world’s oil flows. Markets don’t require an actual closure to respond. They only require uncertainty.
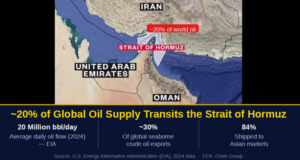
When energy chokepoints come into question, oil prices tend to move first and ask questions later. Because oil is embedded in transportation, manufacturing, logistics, and consumer goods, any sustained spike bleeds into inflation expectations quickly.
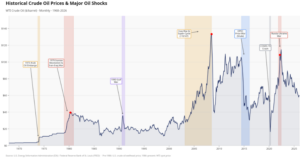
History teaches something important here: energy shocks often feel permanent in the moment, yet many prove transitory unless physical supply is meaningfully disrupted for an extended period. The oil embargo of 1973, the Iranian Revolution in 1979, the Gulf War in 1990, and the Iraq invasion in 2003 each triggered sharp price moves and market anxiety. Each eventually normalized as production, substitution, and economic behavior adapted.
Markets are not static systems. They adjust.
While geopolitics grabs headlines, the housing market tells a quieter story.
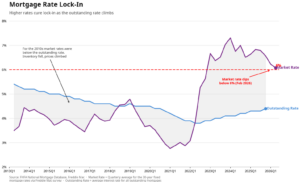
For much of the 2010s, market mortgage rates were below the average outstanding mortgage rate. That dynamic encouraged refinancing, constrained supply, and helped lift prices. The past two years reversed that relationship. Market rates surged
above the average outstanding rate, effectively locking homeowners into low coupons. Inventory dried up not because of distress, but because moving became financially irrational.
Now, with rates drifting back toward 6%, that lock-in pressure may gradually ease. This isn’t a crash narrative. It’s a thawing narrative.
Loan delinquencies have risen to their highest levels since 2017. That deserves attention. But perspective matters.
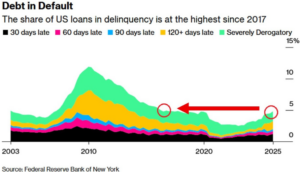
We are nowhere near the leverage excesses of 2008. Household balance sheets remain considerably stronger than during prior systemic downturns. What we are seeing is normalization — stress emerging at the margins after years of stimulus and suppressed defaults.
Housing supply remains historically constrained even as rates normalize.
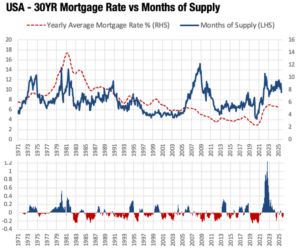
The data suggests adjustments are coming to supply.
Fiscal changes redistribute incentives, and incentives shape behavior.
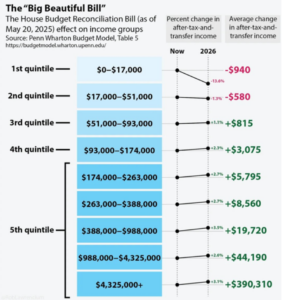
Higher-income cohorts may see incremental after-tax gains, while lower income cohorts face modest contraction. Markets do not adjudicate fairness — they respond to capital allocation patterns.
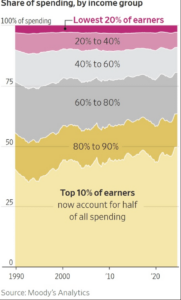
When high earners receive additional after-tax income, it often finds its way into financial assets, private markets, and real estate as well as consumption. Remember, upper-income cohorts now dominate spending.
Weeks like this feel unstable because multiple forces are moving in different directions simultaneously. Lower mortgage rates could help housing. Energy risk could pressure inflation. Consumer delinquencies are rising but not collapsing. Fiscal adjustments create both tailwinds and headwinds depending on income bracket.
Over the past decade, we’ve seen something that feels seismic. Retail employment has drifted lower as e-commerce reshaped the landscape.
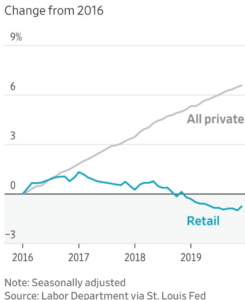
Amazon didn’t destroy employment. It reshaped it. Warehousing rose. Logistics expanded. Cloud computing accelerated. Entire supply chains modernized. Retail storefront jobs declined at the margin, but overall private employment continued climbing. This is the pattern of adaptation.
Now look at energy.
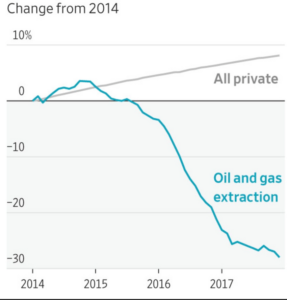
Between 2014 and 2017, oil and gas extraction employment collapsed nearly 30%. It was brutal for that industry. But total private employment kept rising. Energy restructured. Capital reallocated. Labor shifted.
And now AI.
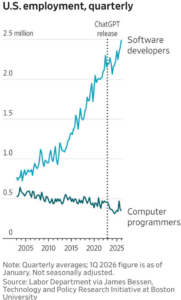
The rise of software developers and the decline of traditional programming roles illustrate something important. Shifts happen even with technology. Since the release of generative AI tools like ChatGPT, software employment has continued to expand. Technological transitions rarely unfold evenly — but history suggests labor markets tend to evolve rather than disappear.
Seismic shifts in specific sectors have repeatedly failed to derail overall employment growth. History shows displacement is real. Systemic collapse is rare.
It’s messy. But messy is normal.
If you have questions or comments, please let us know. You can contact us via X and Facebook, or you can e-mail Tim directly. For additional information, please visit our website.
Tim Phillips, CEO, Phillips & Company
Sources:
Historical Crude Oil Prices & Major Oil Shocks (1968–2026)
-
U.S. Energy Information Administration (EIA), Cushing, OK WTI Spot Price FOB (Dollars per Barrel)
-
Federal Reserve Bank of St. Louis (FRED), Crude Oil Prices: West Texas Intermediate (WTI)
Source: U.S. Energy Information Administration; Federal Reserve Bank of St. Louis (FRED).
Strait of Hormuz Map / Global Oil Transit Flow
-
U.S. Energy Information Administration (EIA), World Oil Transit Chokepoints
Source: U.S. Energy Information Administration.
Mortgage Rate Lock-In Analysis
-
Federal Housing Finance Agency (FHFA), National Mortgage Database
-
Freddie Mac, Primary Mortgage Market Survey® (PMMS®)
Source: Federal Housing Finance Agency; Freddie Mac.
Debt in Default / Loan Delinquencies
-
Federal Reserve Bank of New York, Quarterly Report on Household Debt and Credit
Source: Federal Reserve Bank of New York.
30-Year Mortgage Rate vs. Months of Supply
-
Freddie Mac, Primary Mortgage Market Survey® (PMMS®)
-
National Association of Realtors (NAR), Existing Home Sales & Housing Inventory Data
Source: Freddie Mac; National Association of Realtors.
Income Impact – House Budget Reconciliation Bill
-
Penn Wharton Budget Model, Distributional Analysis of [Bill Name]
Source: Penn Wharton Budget Model, University of Pennsylvania.
Notes: Phases represent historical market behavior across prior cycles; durations approximate.
The charts and data presented are sourced from a combination of public domain materials and licensed data providers. Their use is intended solely for educational and analytical commentary and falls within the scope of fair use. For a representative list of sources, please click here.
The material contained within (including any attachments or links) is for educational purposes only and is not intended to be relied upon as a forecast, research, or investment advice, nor should it be considered as a recommendation, offer, or solicitation for the purchase or sale of any security, or to adopt a specific investment strategy. The information contained herein is obtained from sources believed to be reliable, but its accuracy or completeness is not guaranteed. All opinions expressed are subject to change without notice. Investment decisions should be made based on an investor’s objective.