I just spent a week largely disconnected from markets. I spent time with clients and business owners hearing about their concerns and growth challenges. It was refreshing. It is an exercise I try to repeat periodically, not just for the mental reset from the markets, but for the perspective it forces upon me. When I came back and logged in, I found that very little had changed about the long-term investment outlook, despite plenty of headlines.
The lesson is one that bears repeating: investors often mistake activity for information.
If you had checked your portfolio every hour this week, you would have experienced dozens of reasons to worry. A geopolitical headline here, a central bank comment there, a sudden dip in a tech stock, or a spike in a commodity. But if you checked it once today, you probably missed nothing important.
When we pay too much attention to the day-to-day fluctuations, we pay a cost. It isn’t necessarily a financial cost—though panic-selling certainly is—but an emotional one. We let the noise of the market distract us from the reality of how wealth is actually built.
Markets Generate Noise Every Day
The financial media complex is built on engagement. To keep you watching, reading, and clicking, they need to frame every piece of data as an urgent event. The market obliges by moving every second of every trading day. But movement does not equal meaning.
Businesses Create Value Much More Slowly
While the ticker tape flashes red and green, the underlying businesses you own are operating on a completely different timeline. They are hiring talent, developing new products, expanding into new markets, and optimizing their supply chains. That process takes months, years, and decades, not hours or days.
If you look at the historical data, the longer your time horizon, the less the daily noise matters. Consider the rolling 10-year annualized returns of the S&P 500.
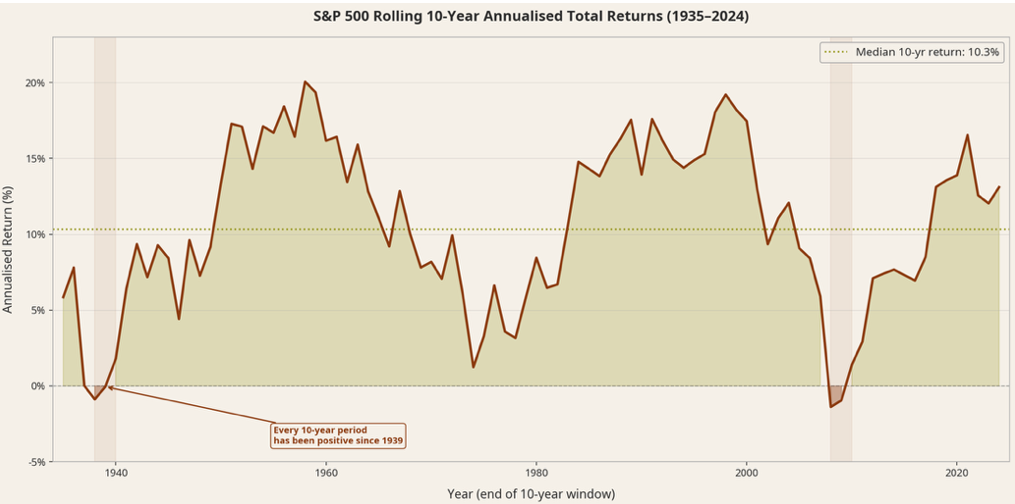
Despite wars, recessions, inflation spikes, and political crises, every single 10-year period since 1939 has delivered a positive annualized return for the S&P 500. The noise is constant, but the upward march of business value creation is historically persistent.
Most Wealth is Built by Owning Productive Assets Through Uncertainty
We often think of “uncertainty” as a reason to avoid investing. In reality, uncertainty is the very reason investments generate a return. If the future were perfectly predictable and guaranteed, there would be no risk premium.
Part of enduring that uncertainty is recognizing that market highs are not an anomaly to be feared, but a normal feature of a growing economy.
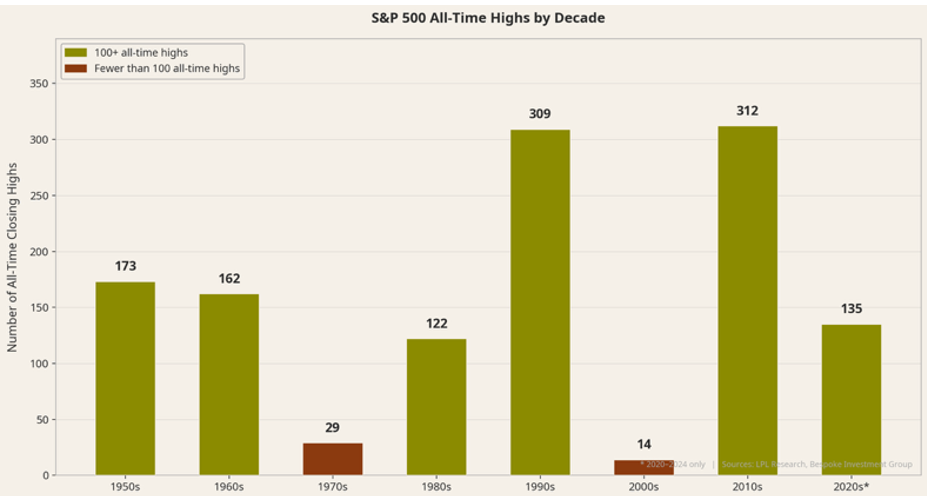
Investors frequently worry when the market hits an all-time high, assuming a crash must be imminent. Yet, as the data shows, all-time highs tend to cluster in decades of strong economic growth. They are a sign that businesses are successfully growing their earnings, not necessarily a warning sign of a bubble.
Underestimating the Next Decade
Investors frequently overestimate the importance of this week’s news and underestimate the importance of the next decade’s earnings growth.
When a drawdown inevitably happens—and they always do—the instinct is to focus on the pain of the decline. But history shows us that major market drawdowns are typically followed by robust recoveries.
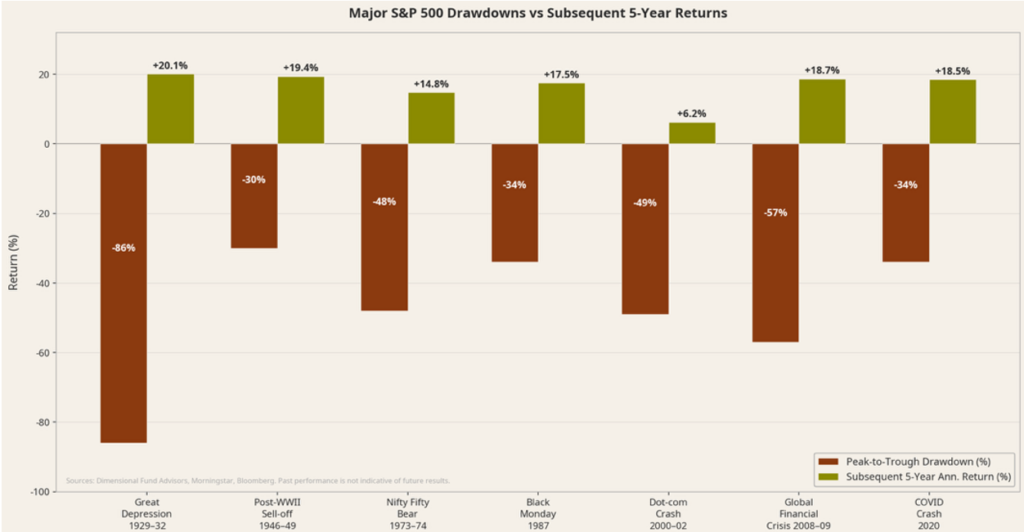
Whether it was the aftermath of the Global Financial Crisis or the sudden shock of the COVID-19 pandemic, the subsequent five-year returns have historically rewarded those who maintained their focus on the long term.
So, the next time you feel the urge to react to a blaring headline or a sudden market move, remember the value of a vacation mindset. Disconnect from the noise. Reconnect with your long-term plan. The market will still be there tomorrow, and the businesses you own will still be working to create value for the decade ahead.
If you have questions or comments, please let us know. You can contact us via X and Facebook, or you can e-mail Tim directly. For additional information, please visit our website.
Tim Phillips, CEO, Phillips & Company
Sources & Data References:
Annual S&P 500 total return figures (including reinvested dividends, 1926–2024) used to construct the rolling 10-year return series come from Slickcharts (slickcharts.com/sp500/returns) and the NYU Stern / Damodaran historical return dataset (pages.stern.nyu.edu/~adamodar), with 10-year annualized figures calculated geometrically from those annual returns. All-time high counts by decade are sourced from One Day In July LLC / MacroTrends, which published a detailed year-by-year ATH table for 1958–2024, cross-referenced with scantips.com, which independently tracks annual record-high closes. Bear market peak-to-trough drawdown figures are drawn from MFS Investment Management’s “Market Declines: A History of Recoveries” (mfs.com), itself sourced from FactSet, and cross-referenced with Yardeni Research’s Bull & Bear Market Tables (yardeni.com); subsequent 5-year annualized returns are calculated from the Damodaran annual total return series measured from each bear market trough. Past performance is not indicative of future results.
The charts and data presented are sourced from a combination of public domain materials and licensed data providers. Their use is intended solely for educational and analytical commentary and falls within the scope of fair use. For a representative list of sources, please click here.
The material contained within (including any attachments or links) is for educational purposes only and is not intended to be relied upon as a forecast, research, or investment advice, nor should it be considered as a recommendation, offer, or solicitation for the purchase or sale of any security, or to adopt a specific investment strategy. The information contained herein is obtained from sources believed to be reliable, but its accuracy or completeness is not guaranteed. All opinions expressed are subject to change without notice. Investment decisions should be made based on an investor’s objective.