
During World War II, Americans did something economists had rarely seen at that scale. They earned more money and saved an extraordinary amount of it.
By 1943, Americans were saving roughly 27% of their disposable income. Some of that was forced on them. Cars were hard to buy. New homes were scarce. Consumer goods were rationed. But there was also a psychological element. After living through the Depression and then a world war, having money in the bank had a value all its own.
By mid-1944, Americans had accumulated roughly $60 billion in liquid savings, an amount the Commerce Department estimated was equal to about eight months of consumer spending at the time.
People spend based on what they earn. They also spend based on how secure they feel.
I thought about that when looking at the July consumer numbers.
Personal income increased 0.4% for the month. Disposable personal income increased 0.5%. Consumer spending increased only 0.2%.
Consumers got a raise. They spent some of it and kept the rest.
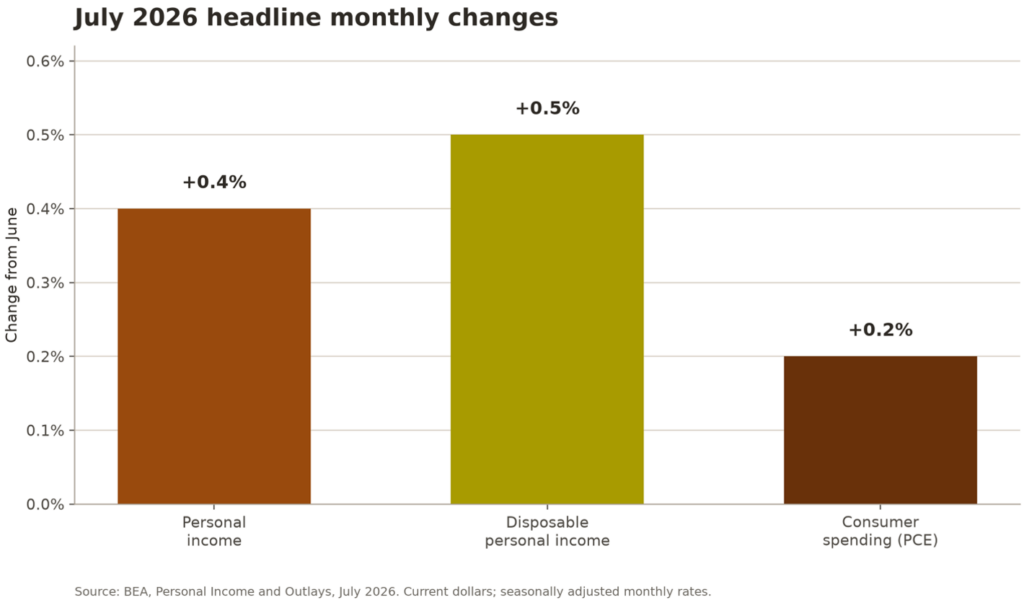
I wouldn’t make too much out of one month’s data, but I do think the relationship is worth watching. For most of the past few years, we have been waiting for the American consumer to finally run out of gas. In spite of inflation, housing costs, rising interest rates and wars, the consumer kept spending anyway.
July looks a little different. Spending continues to grow, but income is growing faster.
Personal income reached about $27.1 trillion at an annual rate in July. Disposable personal income is approaching $23.9 trillion, and consumer spending is around $22.2 trillion. All three continue to rise.
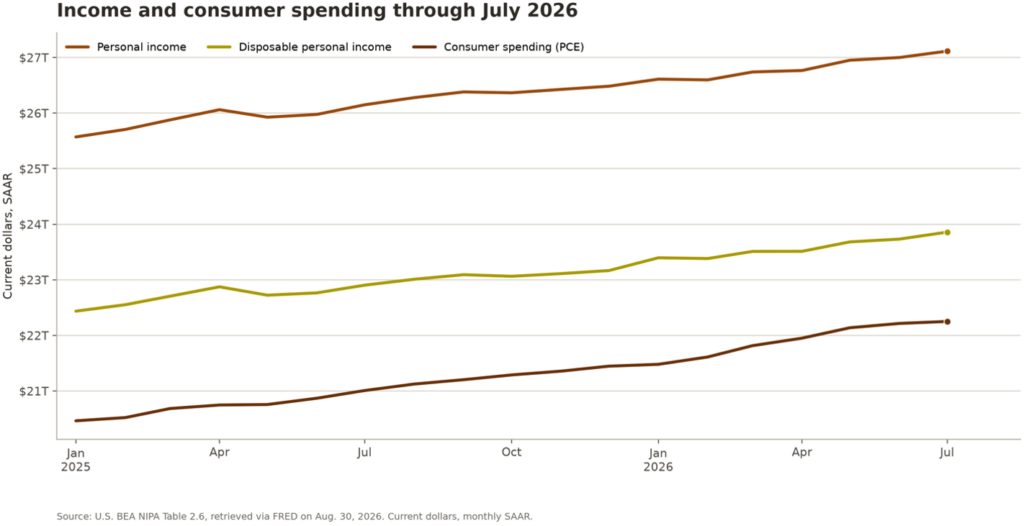
So, I don’t see evidence here that households are retreating. I see people becoming a little more careful with the next dollar they earn.
A consumer who cuts spending because he lost his job is a problem for the economy. A consumer who earns more, continues spending and decides to save a little of the increase is actually improving his balance sheet.
That extra reserve matters when borrowing costs are still high and economic growth is slowing.
The BEA’s personal saving rate increased to 3.0% in July from 2.6% in June. That is hardly a historic savings boom, but the direction is encouraging.
What They’re Buying Matters
The July spending detail also tells us something.
Health care spending increased about $23 billion at an annual rate. Financial services and insurance increased roughly $24 billion. Housing and utilities increased about $16 billion.
Autos declined approximately $9 billion. Gasoline and other energy goods fell roughly $14 billion. Clothing was also down slightly.
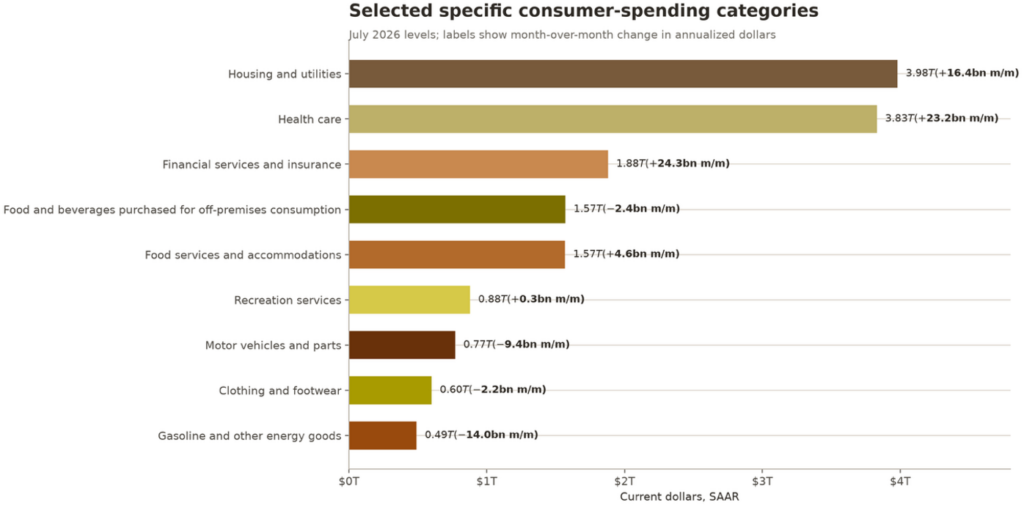
Some of the energy decline is obviously price related, so we need to be careful with the comparison. Still, much of the spending growth is occurring in areas where consumers don’t have a tremendous amount of choice.
Things like insurance, healthcare and electricity are not optional.
Furthermore, discretionary spending looks softer. Restaurants and accommodations continued to grow, which is encouraging. Recreation was nearly flat. Autos declined.
That looks more like selectivity than distress.
The Numbers Have Gotten Very Big
There is one other piece of this that I think gets overlooked.
Personal income has increased from about $15.9 trillion in July 2016 to $27.1 trillion today, an increase of more than 70%.
That works out to roughly 5.5% annualized nominal growth.
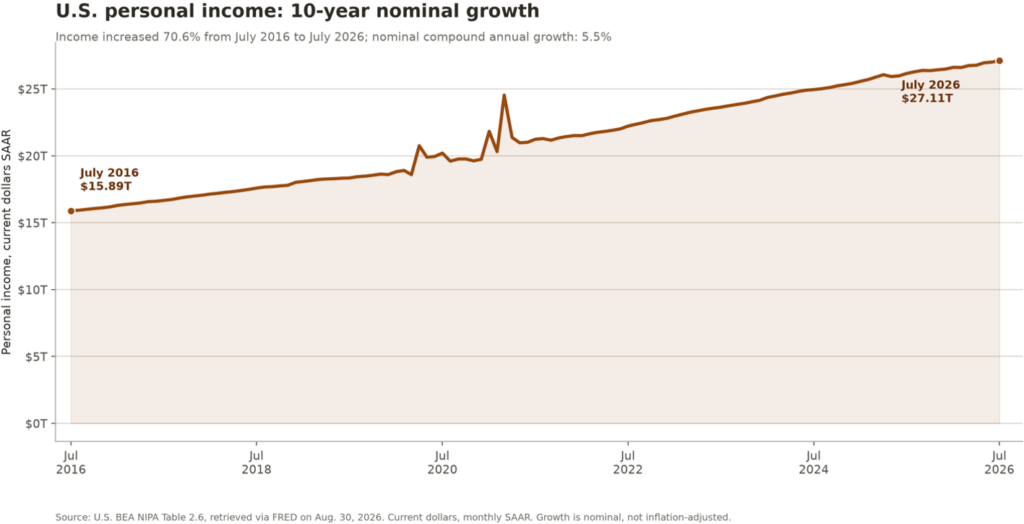
Those are impressive numbers until you remember they are nominal.
A family can earn substantially more than it did ten years ago and still wonder where all the money went. The same dollar of income doesn’t purchase what it used to.
That helps explain one of the stranger parts of this economic cycle. The consumer data has generally looked quite good while consumers themselves often tell pollsters they don’t feel particularly good.
Both can be true.
Why I Like This Development
Consumer spending makes up roughly two-thirds of the U.S. economy, so we spend a lot of time looking for signs that consumers are about to quit spending. That is a precursor to weaker corporate earnings and equity prices.
I’m more interested right now in whether they are rebuilding some financial capacity.
If income continues growing faster than spending, households can gradually increase savings, reduce debt or simply accumulate cash. None of those show up as exciting economic activity today. They make the consumer more durable tomorrow and better able to withstand some shocks
The American consumer has absorbed inflation, higher rates and a substantial increase in the cost of living without collapsing. Maybe the next phase is less dramatic.
Sources & Data References:
U.S. Bureau of Economic Analysis, Personal Income and Outlays, July 2026, released August 26, 2026. Personal income increased 0.4% in July, disposable personal income increased 0.5%, consumer spending increased 0.2%, and the personal saving rate rose to 3.0%. Federal Reserve Bank of St. Louis, FRED, Personal Consumption Expenditures and Disposable Personal Income, July 2026. July PCE totaled approximately $22.25 trillion at a seasonally adjusted annual rate, while disposable personal income was approximately $23.86 trillion.
The charts and data presented are sourced from a combination of public domain materials and licensed data providers. Their use is intended solely for educational and analytical commentary and falls within the scope of fair use. For a representative list of sources, please click here.
The material contained within (including any attachments or links) is for educational purposes only and is not intended to be relied upon as a forecast, research, or investment advice, nor should it be considered as a recommendation, offer, or solicitation for the purchase or sale of any security, or to adopt a specific investment strategy. The information contained herein is obtained from sources believed to be reliable, but its accuracy or completeness is not guaranteed. All opinions expressed are subject to change without notice. Investment decisions should be made based on an investor’s objective.