
There is something remarkable about a hamburger. It’s one of the few things in life that can explain economics better than a room full of PhDs.
In 2006, a Big Mac cost about $2.67. Today, it’s $6.22. That’s an increase of 133%, compared with roughly 68% for the broader Consumer Price Index over the same period. Same two patties, same special sauce, same sesame seed bun. Yet the price has more than doubled.
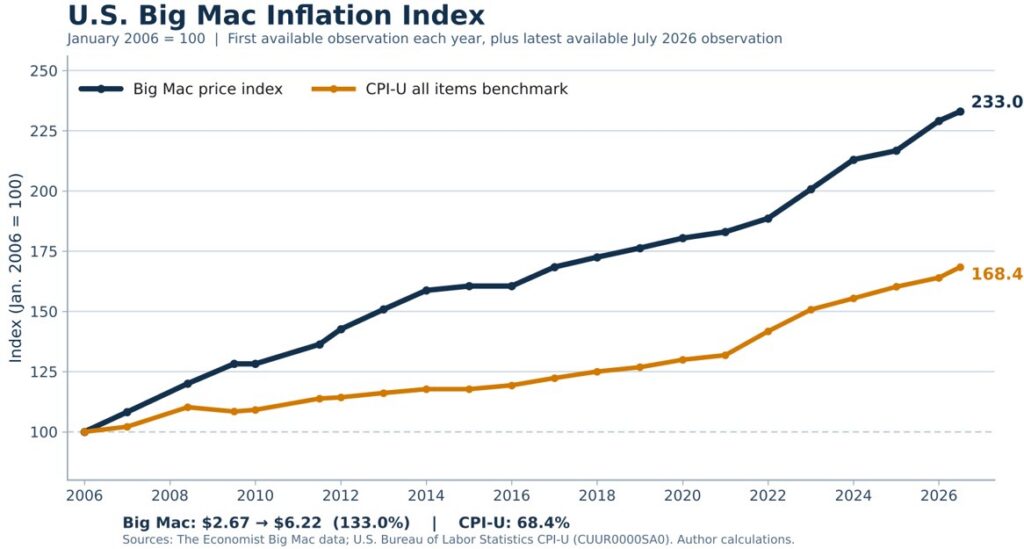
The interesting part isn’t the hamburger. It’s everything that goes into making it.
Beef, bread, transportation, electricity, refrigeration, rent, wages, and the increasing cost of providing benefits and healthcare to the people making and delivering it. A Big Mac is a miniature economy wrapped in paper.
And perhaps that’s why it tells us something the government’s inflation statistics sometimes miss. Americans don’t experience inflation as an index. They experience it as a series of bills that arrive every month, with remarkably few going in the other direction.
Last week’s September CPI report offered another reminder. Consumer prices increased 0.6% for the month and 3.7% over the past year, accelerating from August’s 3.4% annual pace. Core inflation, excluding food and energy, came in at 2.6%.
The numbers aren’t catastrophic, but they’re certainly not moving in the direction the Federal Reserve would like to see. More importantly, the averages don’t tell us much about what is happening to a typical family’s budget.
Start with energy. Gasoline prices increased 9.1% in September alone and 34.2% over the past year. Overall energy costs have climbed 20.4% in 12 months. Electricity is up 4.4%, while natural gas utility service has increased 5%. You can’t simply decide not to drive to work or heat your house. For most families, these aren’t discretionary expenses; they’re the cost of participating in the economy.
Shelter is the next challenge. Housing costs increased 3.2% over the past year, including another 0.4% in September. That may sound manageable until you consider that shelter represents more than a third of the CPI basket. Add property taxes, insurance, maintenance, and the effect of higher mortgage rates, and the real cost of keeping a roof over your head can feel considerably worse than the headline suggests.
Healthcare tells a similar story. Medical care services increased 2.5% over the past year, but hospital services rose 5.6%. And CPI doesn’t capture every frustration of a family dealing with rising insurance premiums, deductibles, and out-of-pocket expenses. It is one thing to postpone a vacation. Postponing medical care is an entirely different decision.
Food, interestingly, was flat in September, and grocery prices actually declined 0.1%. That is welcome news. But food away from home is still up 3.5% over the past year. The problem with inflation slowing is that prices don’t necessarily fall. They simply rise more slowly from a much higher starting point.
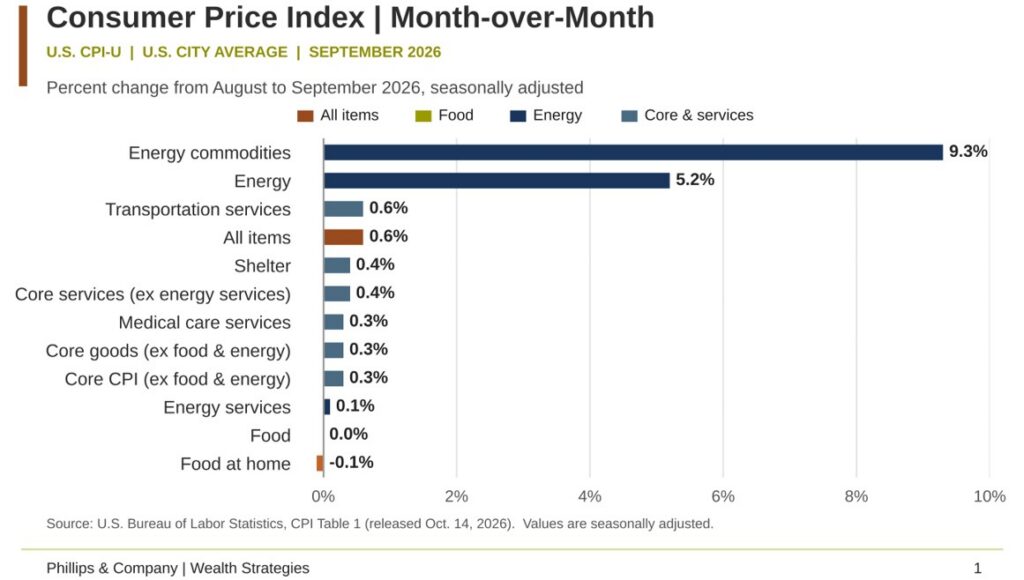
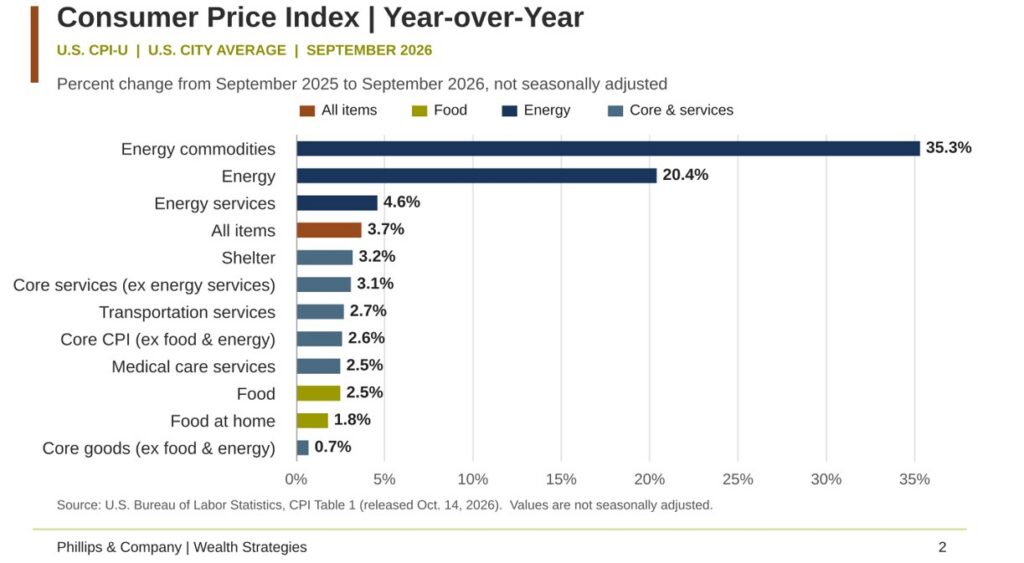
This is the disconnect that matters. Economists can celebrate moderating inflation in certain categories while consumers remain frustrated with the cumulative cost of living. Both can be right. But it’s the consumer who has to balance the checkbook.
And now we have an additional complication.
Corporate America is entering earnings season with remarkably high expectations. Analysts are projecting roughly 31% year-over-year earnings growth for the S&P 500 in the third quarter, with much of that growth concentrated in technology and AI-related businesses. That is an impressive number, but it creates an interesting problem: when everyone expects great earnings, great earnings may no longer be enough.
At the same time, inflation is raising the possibility of higher interest rates. That matters because the value of a company isn’t determined solely by how much it earns today but also by what investors are willing to pay for its future earnings.
Strong earnings can push stocks higher. Higher interest rates can pull valuations lower. Both can happen at the same time.
A company can execute flawlessly, deliver record profits, and still see its stock decline because investors are suddenly applying a higher discount rate to those future cash flows. The longer the expected payoff, the more sensitive that valuation can become.
This puts investors in an awkward position. Corporate profits can be growing, the economy can remain reasonably healthy, and the market can still experience a significant correction. Not because the underlying businesses have suddenly deteriorated, but because the price investors are willing to pay for those businesses has changed.
And the Federal Reserve may be about to make that calculation even more difficult.
This year’s Nobel Memorial Prize in Economic Sciences went to Robert Hall and Michael Woodford, whose work helped explain how household and business decisions are shaped by expectations about the future. Woodford’s research, building on the monetary tradition of Knut Wicksell, helped establish the importance of central-bank communication and forward guidance in managing economic expectations.
The irony is that Fed Chairman Kevin Warsh has been moving in the opposite direction. He believes the Fed has become too vocal, too dependent on signaling its next move, and too willing to manage financial markets’ expectations rather than allow the economic data to speak for itself.
It’s a fascinating philosophical disagreement. Woodford’s framework places substantial importance on guiding expectations. Warsh would prefer to give markets less advance notice and let them do more of the work.
Both approaches have merit. But markets have become accustomed to the Fed providing something close to a road map. Taking away that road map doesn’t eliminate uncertainty. It transfers more of the burden of interpreting policy to investors.
That means more uncertainty about the direction of rates, which complicates everything from mortgage decisions and corporate borrowing to capital budgeting, acquisitions, and equity valuations. Just as important, it could introduce considerably more volatility into the bond market, which rarely stays confined to bonds.
And that brings me back to the investor.
We spend an extraordinary amount of time worrying about whether the next market correction will be 5%, 10%, or perhaps 20%. History suggests we should spend considerably less time asking whether these declines will happen and more time understanding how frequently they occur.
Over nearly a century of market history, 5% corrections have occurred roughly once every 16 months, 10% drawdowns approximately every four years, and 20% declines about every eight years. Over rolling 10-year investment horizons, nearly every period included at least one bear-market-sized decline.
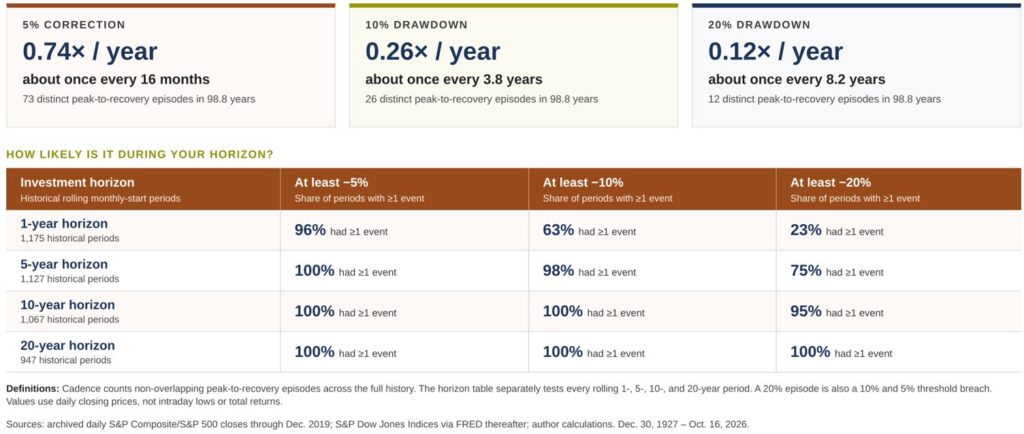
Those figures aren’t predictions. They’re reminders that volatility is not some unusual interruption to the investment experience. Volatility is part of the admission price for owning productive assets over long periods of time.
The mistake investors often make is allowing a short-term decline to redefine a long-term objective. A portfolio designed to compound wealth over 10 or 20 years suddenly gets evaluated on what happened over 10 or 20 trading days.
That’s not investing. That’s changing the rules halfway through the game.
My advice as we enter what could be a tricky period is straightforward: re-anchor your time frame. If the money is needed next year, it shouldn’t be exposed to the same risks as capital intended for the next decade. But if the objective is long-term growth, a correction should be something you have planned for, not something that forces you to abandon the plan.
We may get terrific earnings. We may get higher interest rates. We may get both, which would make for a very interesting market. There is no contradiction in being optimistic about the long-term prospects for American businesses while expecting a more difficult investment environment over the next several quarters.
Twenty years ago, the Big Mac was cheaper, the stock market was lower, and plenty of investors were convinced the next crisis would change everything.
The burger got more expensive. Businesses kept adapting. Markets experienced their share of corrections, recoveries, and new highs.
The lesson isn’t that prices always go up or that markets never go down. It’s that your investment time horizon should be longer than the next alarming headline.
And preferably longer than it takes to finish lunch.
If you have questions or comments, please let us know. You can contact us via X and Facebook, or you can e-mail Tim directly. For additional information, please visit our website.
Tim Phillips, CEO, Phillips & Company
Sources & Data References:
U.S. Bureau of Labor Statistics, September 2026 Consumer Price Index (October 14, 2026); The Economist, Big Mac Index; Federal Reserve Bank of St. Louis, historical CPI series; Sveriges Riksbank, 2026 Economics Prize announcement; Reuters, October 2026 reporting on corporate earnings expectations and Federal Reserve communication; and S&P Composite/S&P 500 historical closing prices through October 16, 2026. The historical drawdown statistics and Big Mac comparisons are based on Phillips & Company calculations.
The charts and data presented are sourced from a combination of public domain materials and licensed data providers. Their use is intended solely for educational and analytical commentary and falls within the scope of fair use. For a representative list of sources, please click here.
The material contained within (including any attachments or links) is for educational purposes only and is not intended to be relied upon as a forecast, research, or investment advice, nor should it be considered as a recommendation, offer, or solicitation for the purchase or sale of any security, or to adopt a specific investment strategy. The information contained herein is obtained from sources believed to be reliable, but its accuracy or completeness is not guaranteed. All opinions expressed are subject to change without notice. Investment decisions should be made based on an investor’s objective.