
I’m having a lot of discussions with clients and colleagues on the headline US debt. It’s real and serious, but it’s not the first time we’ve seen this kind of macroeconomic event.
In 1946, Americans had plenty to worry about.
The country had just finished financing the largest war in its history. Federal debt had exploded relative to the size of the economy. Millions of soldiers were coming home and factories had to convert from tanks and bombers back to refrigerators and automobiles. Economists worried unemployment could surge as wartime production disappeared.
Instead, something quite different happened.
American households went shopping.
Years of rationing, accumulated savings, rising wages, and enormous pent-up demand helped launch one of the great consumer expansions in American history. The federal debt didn’t disappear. The economy simply grew around it.
That history isn’t an argument that today’s federal debt doesn’t matter. It does. Today’s deficits are more structural, entitlement obligations are much larger, and the cost of financing the debt is becoming increasingly painful.
But it illustrates an important distinction that is getting lost in many of the conversations I’m having with investors:
Washington can have a debt problem without the American consumer simultaneously having one.
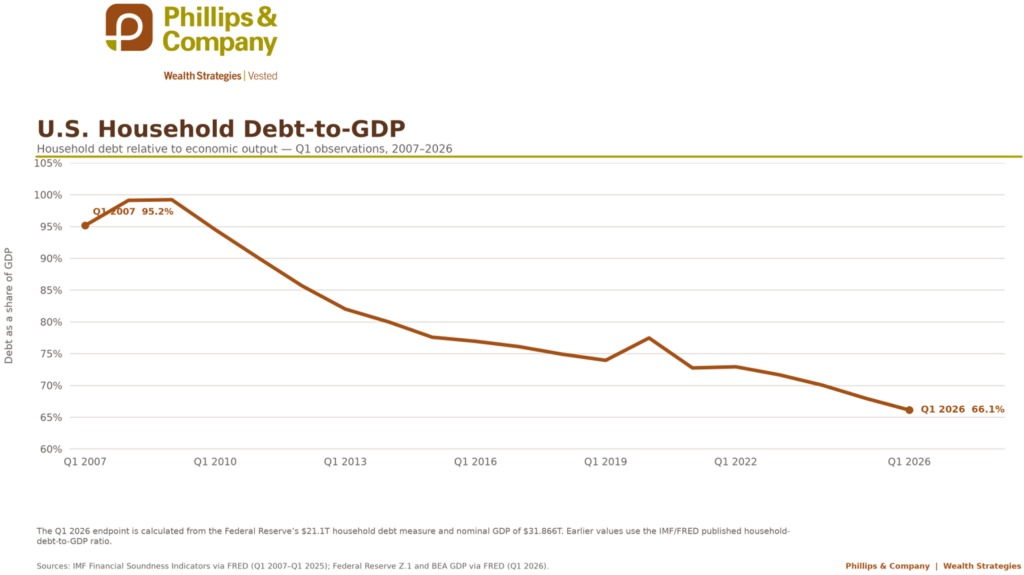
Household debt has fallen from roughly 95% of GDP in 2007 to about 66% today. In other words, while the government’s balance sheet has deteriorated, household leverage relative to the economy has moved dramatically in the opposite direction.
That doesn’t mean every household is healthy. Credit-card borrowers, lower-income consumers, and prospective homebuyers facing today’s mortgage rates can certainly feel squeezed.
But this is not 2007. Back then, the financial system entered trouble with an overleveraged consumer sitting at its center. Today, the leverage problem resides much more clearly in Washington.
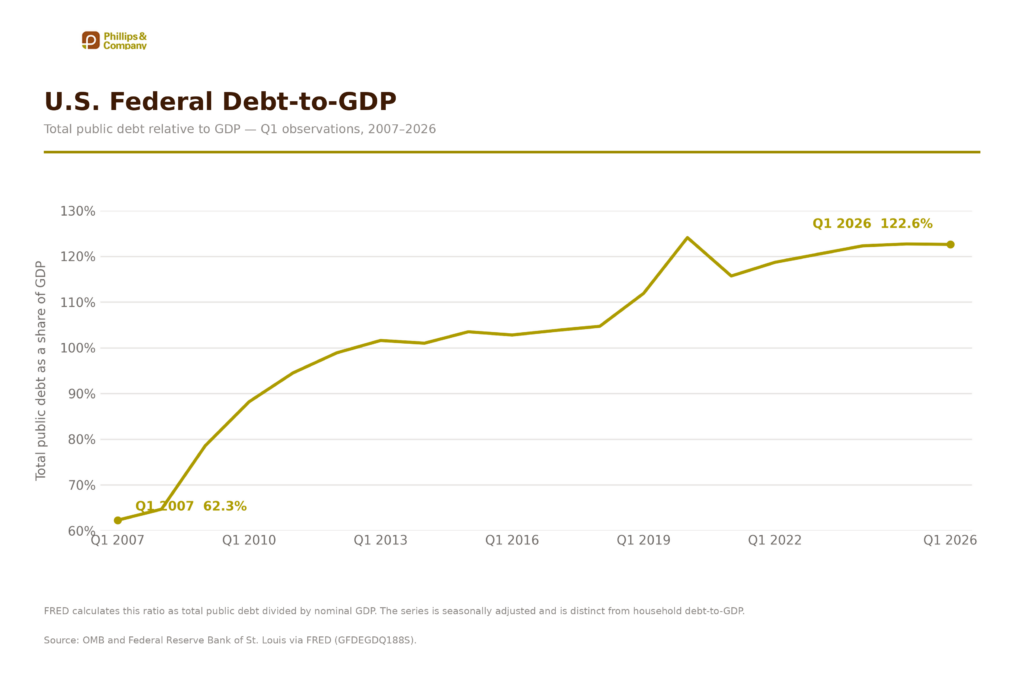
And Washington does have a problem.
Federal debt relative to GDP has roughly doubled since the financial crisis. The concern isn’t simply the size of the debt. A country with a growing economy can support more debt over time.
The issue is the price of carrying it.
This is where I think the discussion becomes much more useful.
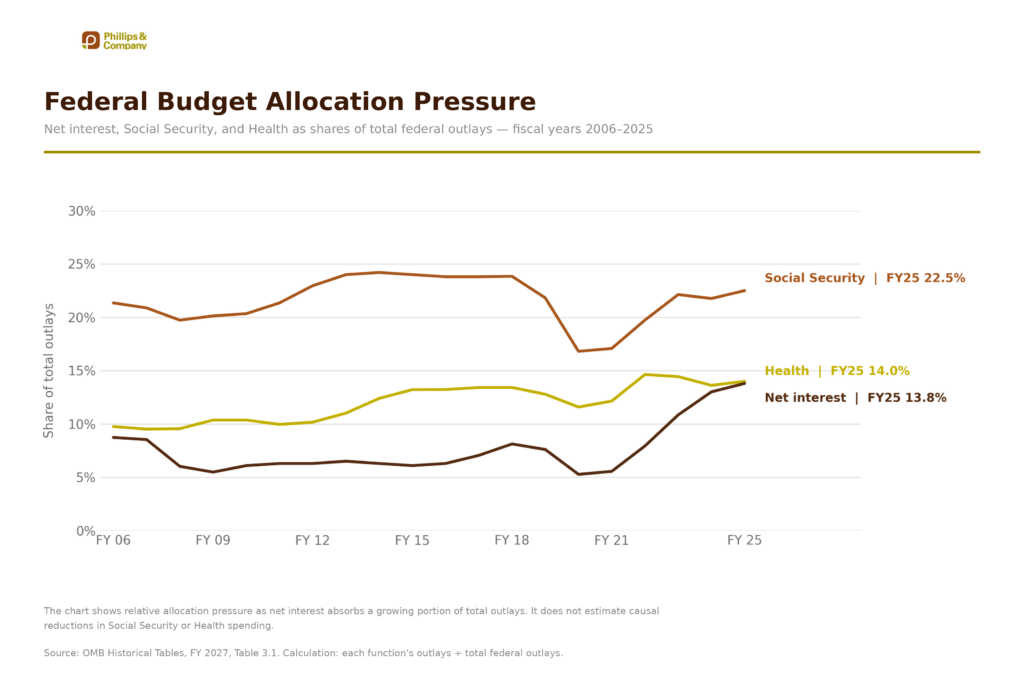
Net interest consumed approximately 14% of federal spending in fiscal 2025, roughly comparable to federal health spending in your chart. CBO projects federal net interest expense to exceed $1 trillion in 2026 and continue growing over the coming decade.
That’s the transmission mechanism investors should watch. With cuts to critical payments for retirement or healthcare, the consumer will feel the squeeze.
Higher interest costs don’t suddenly cause someone in Portland to stop buying groceries. They gradually reduce Washington’s flexibility and impact the consumer in the very long run.
Those are meaningful consequences. But they tend to operate over years, not Tuesday afternoon.
And that brings us back to the consumer.
August payrolls increased by 162,000, unemployment remained 4.1%, and average hourly earnings were up 3.1% from a year ago.
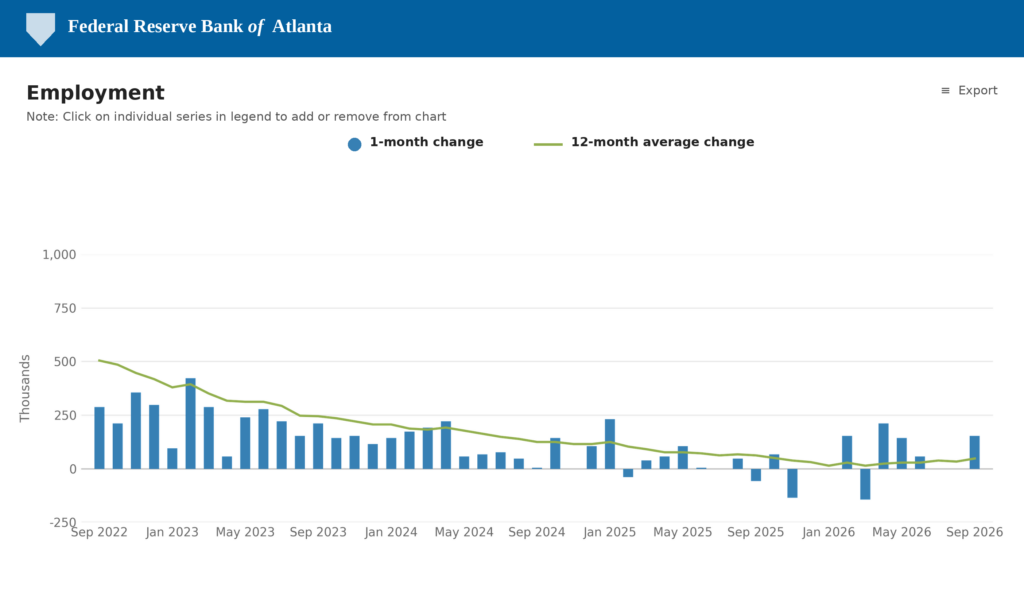
Wage growth has clearly slowed. That’s probably healthy at this stage of the cycle.
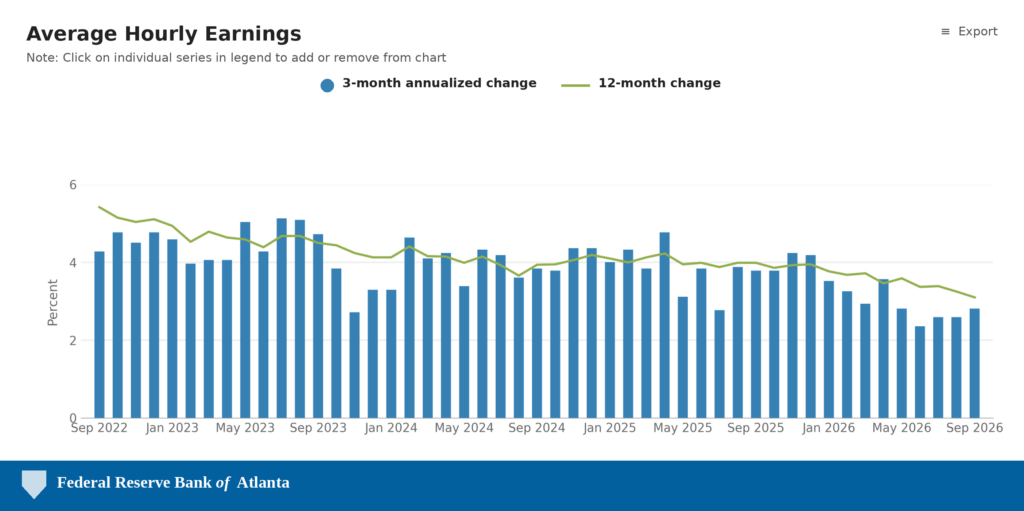
More importantly, income is still growing, and employment is still expanding. August job creation was also relatively broad, with gains in leisure and hospitality, construction, manufacturing, healthcare, and government, while information and financial activities contracted.
For consumption, those variables matter much more immediately than the headline federal debt number.
People generally don’t wake up, check the debt-to-GDP ratio, and decide whether to have dinner out.
They ask whether they have a job or their paycheck is growing, and whether they believe they’ll still have a job six months from now.
That’s the consumer transmission mechanism we should be watching.
Then there are interest rates. Higher Treasury rates absolutely matter.
They raise mortgage rates. They increase corporate financing costs. They make bonds more competitive with stocks. They pressure businesses dependent on inexpensive capital. And over time, they can slow hiring and investment.
That’s why I’m not dismissing the recent move in rates.
But markets have already begun doing some of the adjustments for us.
Earlier this year, investors were paying roughly 22 times forward earnings for the S&P 500. With rising earnings estimates and the recent valuation compression, that multiple has fallen to roughly 19.7 times — back in the neighborhood of the market’s recent five-year valuation range rather than the stretched levels we were discussing earlier this year. FactSet’s five-year average was about 19.9 times earlier in 2026.
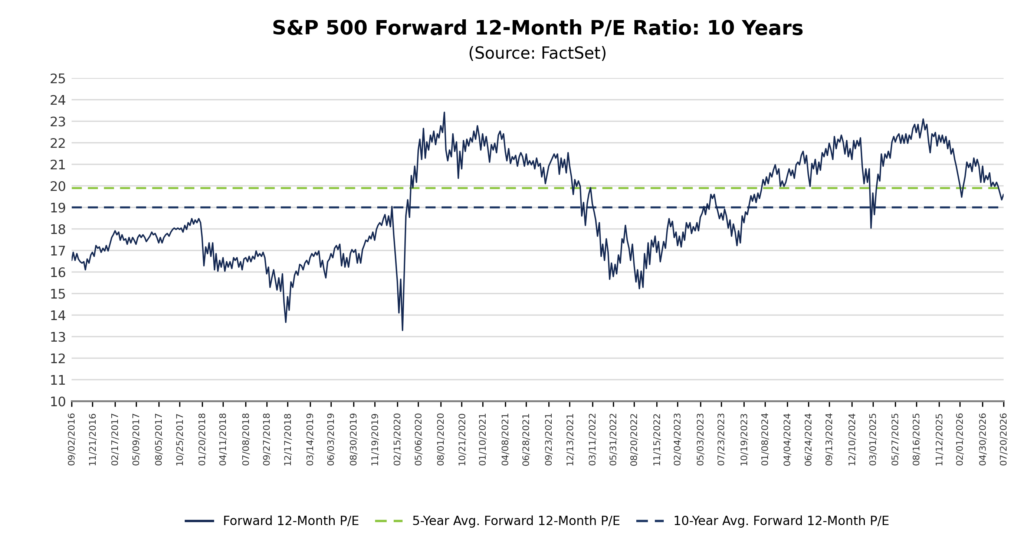
Investors frequently make an analytical mistake during periods like this: they identify a legitimate problem and then assume every asset must therefore be mispriced.
But stock prices and valuations have already moved in response, while corporate earnings expectations have remained surprisingly resilient. Analysts actually increased third-quarter S&P 500 earnings estimates during July and August, an unusual development because estimates normally drift lower as a quarter progresses.
Investing isn’t about determining whether something is good or bad.
It’s about determining what is already reflected in the price.
The federal government probably needs a diet.
The American household, however, is carrying considerably less leverage relative to the economy than it was twenty years ago. Wages are still rising, and employment is still growing. And equity valuations have already come back toward more normal territory.
That’s not a reason to ignore the debt.
It’s a reason not to confuse Washington’s balance sheet with your own.
“A problem can be serious without being urgent, and urgent without being catastrophic. Investing gets expensive when we confuse the three.” – Morgan Housel, financial author and investor
If you have questions or comments, please let us know. You can contact us via X and Facebook, or you can e-mail Tim directly. For additional information, please visit our website.
Tim Phillips, CEO, Phillips & Company
Sources & Data References:
U.S. Bureau of Labor Statistics, Employment Situation and average hourly earnings data; Federal Reserve Bank of Atlanta; Federal Reserve Bank of St. Louis (FRED); U.S. Treasury Financial Report; Office of Management and Budget historical tables; Congressional Budget Office budget and interest-cost projections; FactSet earnings and forward valuation data; and Standard & Poor’s market data.
The charts and data presented are sourced from a combination of public domain materials and licensed data providers. Their use is intended solely for educational and analytical commentary and falls within the scope of fair use. For a representative list of sources, please click here.
The material contained within (including any attachments or links) is for educational purposes only and is not intended to be relied upon as a forecast, research, or investment advice, nor should it be considered as a recommendation, offer, or solicitation for the purchase or sale of any security, or to adopt a specific investment strategy. The information contained herein is obtained from sources believed to be reliable, but its accuracy or completeness is not guaranteed. All opinions expressed are subject to change without notice. Investment decisions should be made based on an investor’s objective.