
Several years ago I was driving through the mountains when I came across an old steel bridge. Like most bridges, there was a sign posted before the entrance listing its maximum weight. I don’t remember the exact number, but I remember thinking that someone, somewhere, had calculated precisely how much that bridge could safely carry.
One truck crossed. Then another, and eventually thousands of trucks crossed without incident.
After enough successful trips, nobody pays attention to the sign anymore. The bridge becomes part of the landscape. Confidence replaces caution, and the weight limit feels more like a suggestion than an engineering calculation.
Then one afternoon another truck starts across.
If the bridge were to fail that day, everyone would blame the last truck.
They shouldn’t. The bridge didn’t fail because of the final truck. It failed because over time the weight being placed on it quietly increased until there was almost no room left for error.
I’ve been thinking about that bridge as I’ve watched today’s stock market.
Most conversations about the market today revolve around artificial intelligence, interest rates or earnings. Those are all important topics, but I think there’s another story developing beneath the surface that deserves just as much attention. It isn’t about what investors are buying. It’s about how they’re buying it.
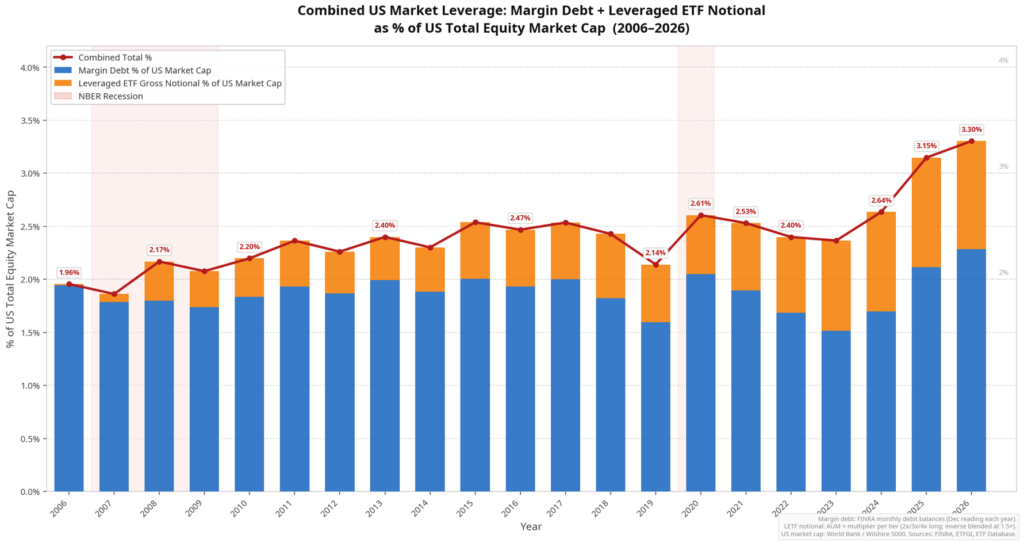
Margin debt has climbed to record levels, and leveraged ETFs have grown from a niche product into a meaningful part of the market landscape. When you combine those two sources of leverage, borrowed exposure has steadily increased relative to the size of the U.S. stock market. The bridge is carrying more weight than it used to.
That doesn’t mean it’s about to collapse. It simply means it has become more sensitive to whatever crosses it next.
Leverage has always been part of investing. Used responsibly, it can be a valuable tool. Businesses borrow money to grow. Real estate investors finance properties. Even corporations use leverage to improve returns on capital. Borrowing itself isn’t the problem.
The problem begins when investors forget they’re borrowing.
One of the biggest changes over the past decade has been the rapid growth of leveraged ETFs. What started as specialized products for active traders has become a large and growing segment of the investment industry. These funds are designed to magnify daily returns, and they accomplish exactly what they’re supposed to do. The unintended consequence is that they also magnify trading activity during periods of market stress. As prices rise, they often buy more, and as prices fall, they frequently become sellers. None of that determines where the market is headed, but it can influence how quickly it gets there.
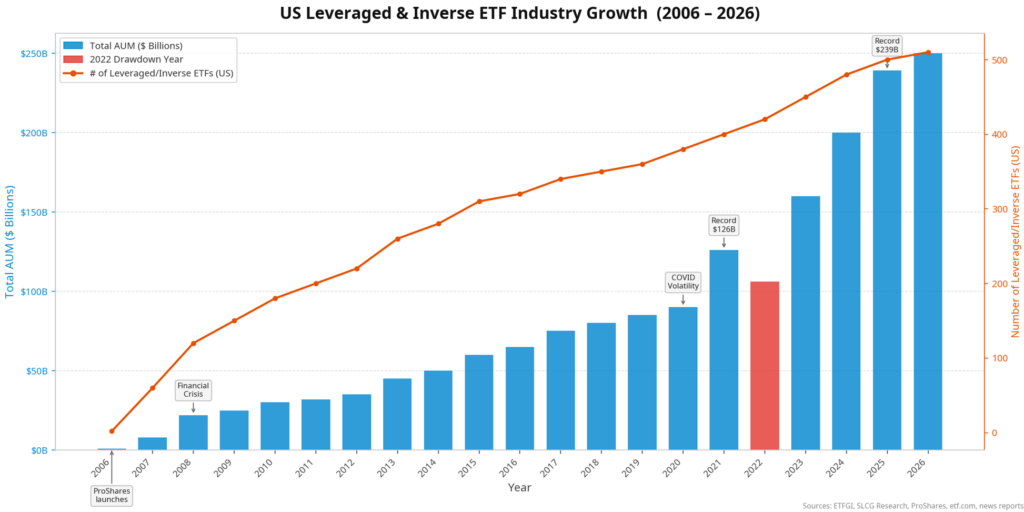
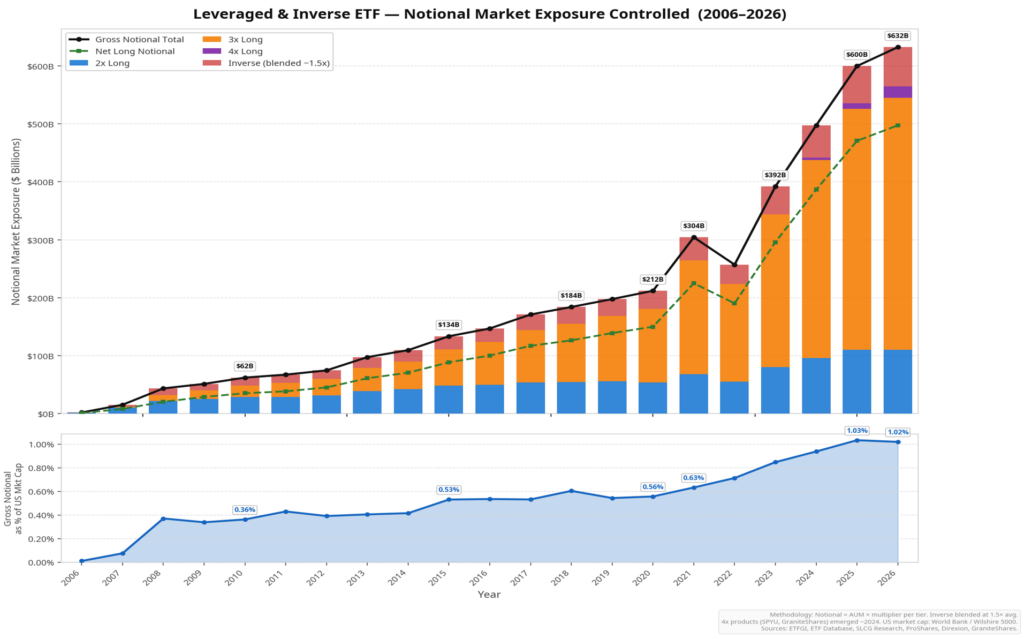
That’s an important distinction. Leverage rarely causes bear markets. It does tend to amplify them.
Think back to the bridge.
The final truck wasn’t unusual. It simply arrived after years of additional weight had accumulated.
Markets behave much the same way. Recessions, geopolitical events, disappointing earnings or policy mistakes often provide the initial spark. What determines whether the decline remains orderly or becomes more violent is frequently the amount of leverage already embedded in the system. Borrowed money creates forced sellers, and forced sellers have a way of creating more forced sellers.
That’s why market declines often move much faster than market advances.
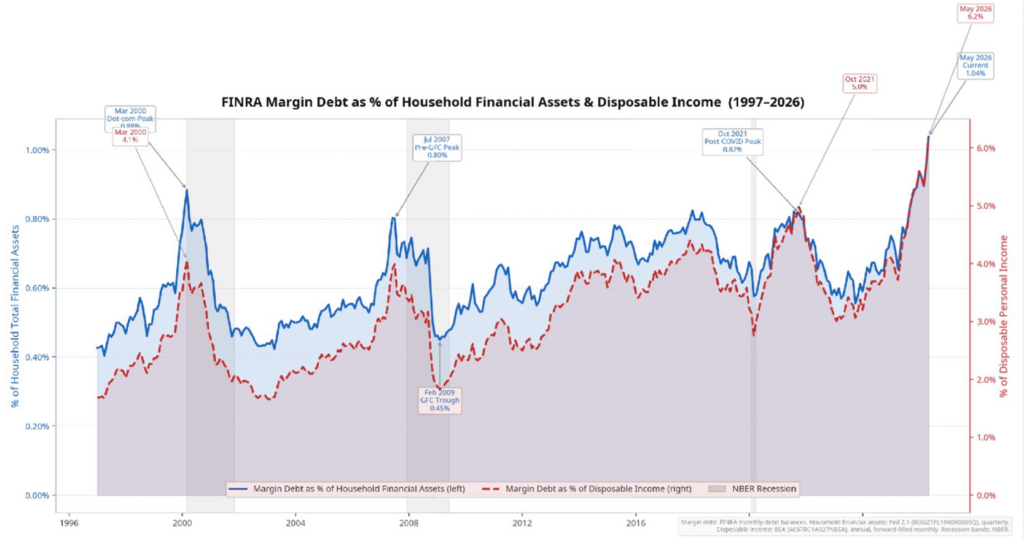
One chart in particular caught my attention while researching this piece. Margin debt isn’t just high in absolute dollars. It’s also elevated relative to household financial assets and disposable income, suggesting investors are carrying historically large amounts of borrowed exposure compared with their own balance sheets. We’ve seen similar conditions before periods of heightened volatility, although history also reminds us that leverage is a poor timing tool. Markets can remain highly leveraged for much longer than most people expect.
That brings us back to the original question. How much leverage is too much?
The honest answer is that nobody knows until after the fact.
The engineers who designed the bridge understood its theoretical limit, but they couldn’t predict which truck would arrive on which day. Investors face the same challenge. We can identify growing risks, but we rarely know what event, if any, will expose them.
I’m not writing this because I think investors should head for the exits. In fact, history argues against making investment decisions based on leverage alone. Bull markets often continue long after leverage reaches uncomfortable levels, and healthy earnings can support higher prices for years.
What I do think is changing is the character of the market itself.
Today’s market is more leveraged than previous cycles. It contains more passive money, more derivatives, more systematic trading and more products designed to amplify returns. None of that guarantees trouble ahead, but it does suggest that when volatility eventually returns, as it always does, the path may be steeper than many investors have grown accustomed to.
The bridge may stand for many more years. My point isn’t that it’s about to fail. My point is simply that it’s carrying more weight than most people realize.
If you have questions or comments, please let us know. You can contact us via X and Facebook, or you can e-mail Tim directly. For additional information, please visit our website.
Tim Phillips, CEO, Phillips & Company
Sources & Data References:
FINRA Margin Statistics; Federal Reserve Financial Accounts of the United States (Z.1); U.S. Bureau of Economic Analysis (Disposable Personal Income); ETFGI Global ETF & ETP Industry Reports; ETF.com industry data; Investment Company Institute (ICI) 2025 Investment Company Fact Book; ProShares and Direxion product data; Wilshire Indexes and World Bank historical U.S. equity market capitalization data; and Hyman Minsky’s Financial Instability Hypothesis (“stability breeds instability”).
The charts and data presented are sourced from a combination of public domain materials and licensed data providers. Their use is intended solely for educational and analytical commentary and falls within the scope of fair use. For a representative list of sources, please click here.
The material contained within (including any attachments or links) is for educational purposes only and is not intended to be relied upon as a forecast, research, or investment advice, nor should it be considered as a recommendation, offer, or solicitation for the purchase or sale of any security, or to adopt a specific investment strategy. The information contained herein is obtained from sources believed to be reliable, but its accuracy or completeness is not guaranteed. All opinions expressed are subject to change without notice. Investment decisions should be made based on an investor’s objective.