
There is an old investing problem that never seems to go away. We see a number, decide what it means, and then go looking for evidence to support the conclusion. A bad jobs report means the economy is bad. A high P/E means stocks are expensive. Inflation means consumers are struggling. Sometimes those conclusions are right. But markets usually get more interesting when you ask the second question: What is actually underneath the number?
That was my reaction to Friday’s jobs report.
The headline was certainly ugly. The U.S. economy lost 23,000 jobs in July, the first monthly decline in several months. The unemployment rate actually edged down to 4.1%, although part of that improvement reflected people leaving the labor force. There is no question the labor market has slowed.
But I’m not sure the headline number tells us nearly as much as people think it does.
Look at where the losses actually occurred.
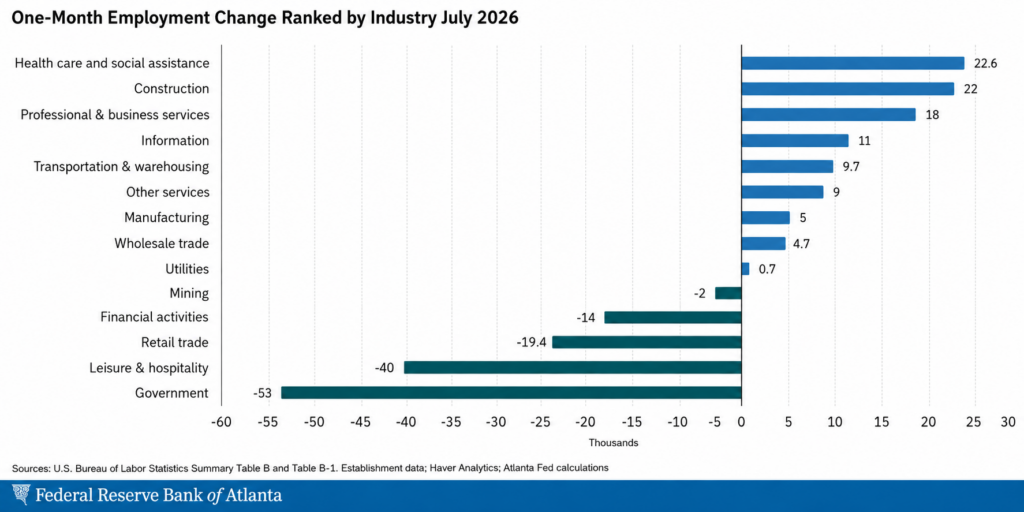
Government employment fell 53,000 jobs. Leisure and hospitality lost another 40,000. Those two categories alone lost 93,000 jobs in a month when total payrolls fell just 23,000.
Meanwhile, health care added roughly 23,000 jobs. Construction added 22,000. Professional and business services added 18,000. Information added 11,000. Manufacturing, transportation and wholesale trade were all positive.
That doesn’t make this a strong jobs report. It wasn’t. But it does make it a much more nuanced jobs report.
The private sector still added about 30,000 jobs. What we really had was a fairly soft underlying labor market overwhelmed by two unusually large declines in very specific parts of the economy.
And both deserve a closer look.
Leisure and hospitality lost 40,000 jobs in July, with food services and drinking places accounting for about 26,000 of the decline.
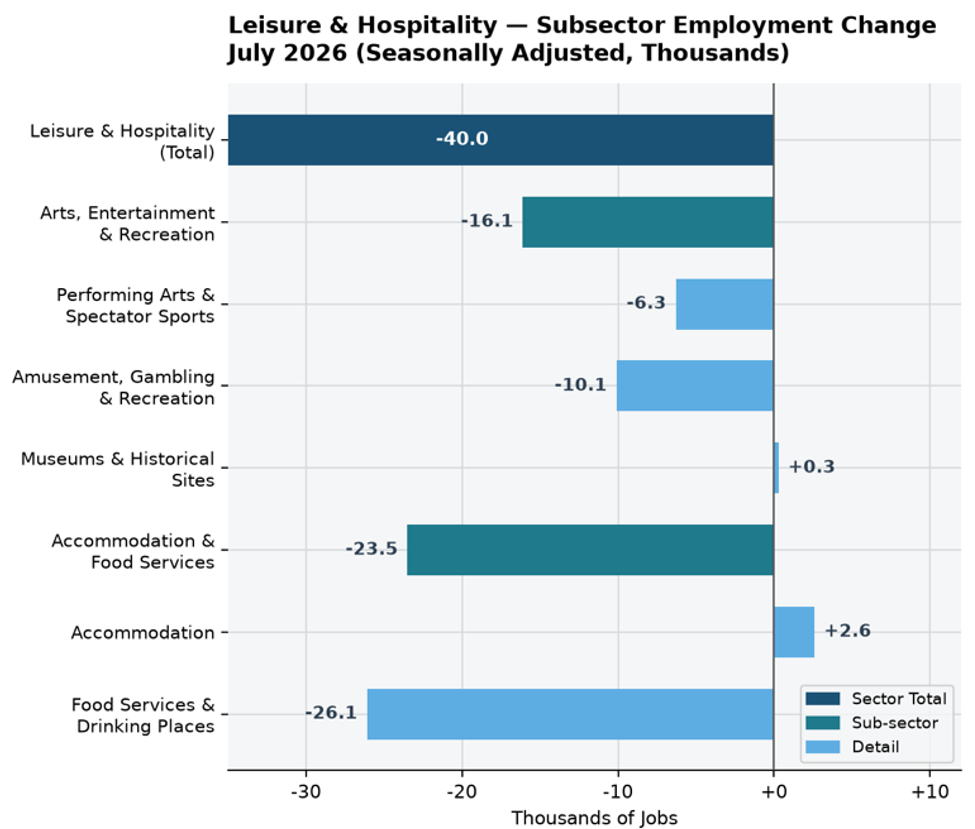
But July also happened to mark the end of one of the largest temporary tourism and entertainment events the country has ever hosted. The World Cup ran from June 11 through the final on July 19.
We knew going into the tournament that employment effects could show up in hospitality, restaurants, transportation and event-related services. Economists at Goldman Sachs had estimated the World Cup could temporarily add tens of thousands of jobs concentrated in many of those categories. So, it should not be terribly surprising that some of those jobs disappeared as the tournament ended.
In fact, economists looking at the July report specifically pointed to the post-World Cup period as a potential contributor to the leisure and hospitality decline. And this is exactly why we have to be careful with a one-month data point.
A temporary event ends and businesses adjust their employment to reflect reduced demand. The entire thing gets condensed into a headline saying the economy “lost jobs.” That is Technically correct but, economically, perhaps a little less dramatic.
Government employment is an even better example.
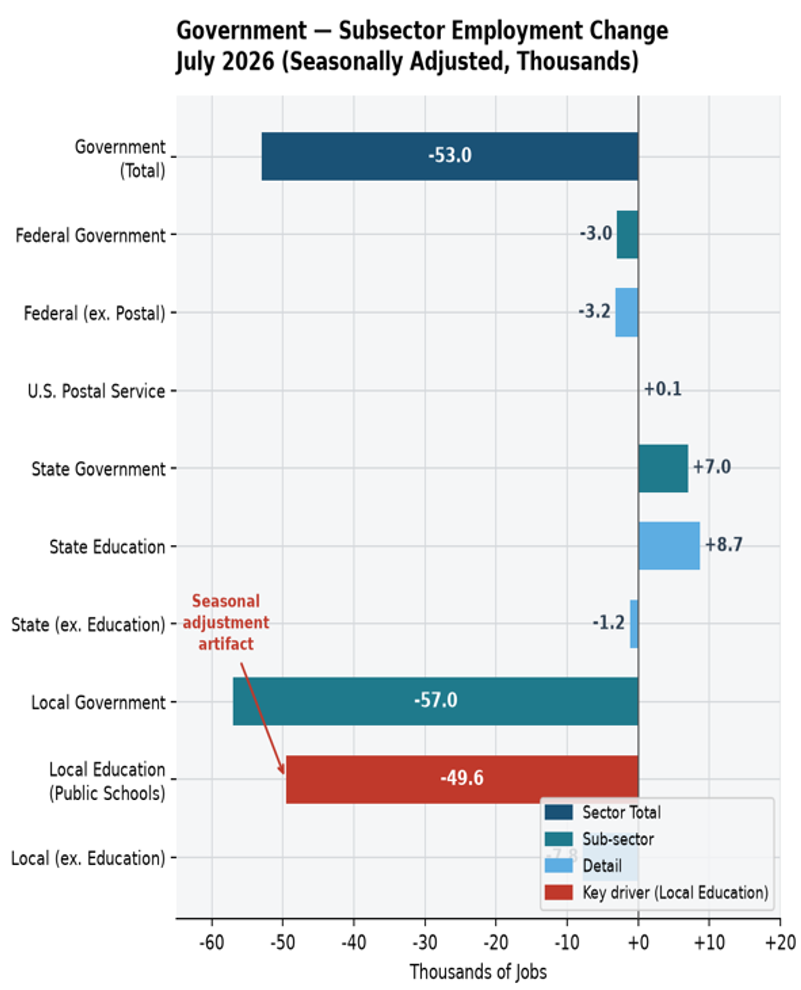
The government sector lost 53,000 jobs.
That sounds significant until you discover that local government lost 57,000 and almost 50,000 of those jobs were in local public education. In other words, almost the entire government decline came from one extremely seasonal category: schools.
July is obviously a strange month to measure employment in public education. Teachers and school employees move on and off payrolls around the summer break, and seasonal-adjustment models attempt to estimate what “normal” looks like, but they can get it wrong.
So now we have two of the largest contributors to July’s weak employment report tied to areas where temporary and seasonal effects are unusually important.
That does not mean the labor market is healthy; it does mean I would hesitate before turning one ugly headline into a recession forecast.
And there is another part of the employment report that received much less attention.
Wages.
We spent most of 2021 and 2022 talking about wages losing the race against inflation.
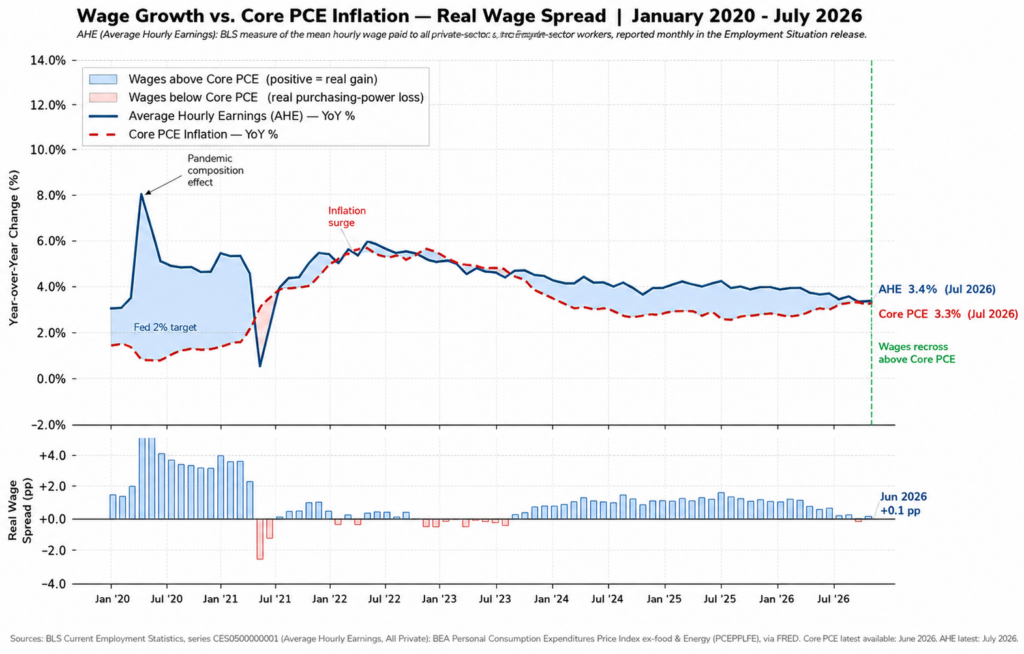
Workers were getting raises, but prices were rising faster. That matters because consumers don’t really care what their nominal paycheck says. They care what it buys.
That equation has improved dramatically. Average hourly earnings are growing around the mid-3% range, while core PCE inflation is running in roughly the same neighborhood. The enormous loss of purchasing power we experienced during the inflation surge has largely disappeared.
For most of the last several years, wage growth has exceeded core inflation. The spread has narrowed recently, but workers are still roughly maintaining their purchasing power. This is why the consumer is in a bad mood but still spending.
That is a very different consumer backdrop than we had during peak inflation. And I think this becomes important when we make the jump from the economy to the stock market.
Because while everyone is spending considerable time trying to determine whether a 23,000-job decline means the economy is rolling over, corporate America is doing something almost completely different.
It is producing extraordinary earnings.
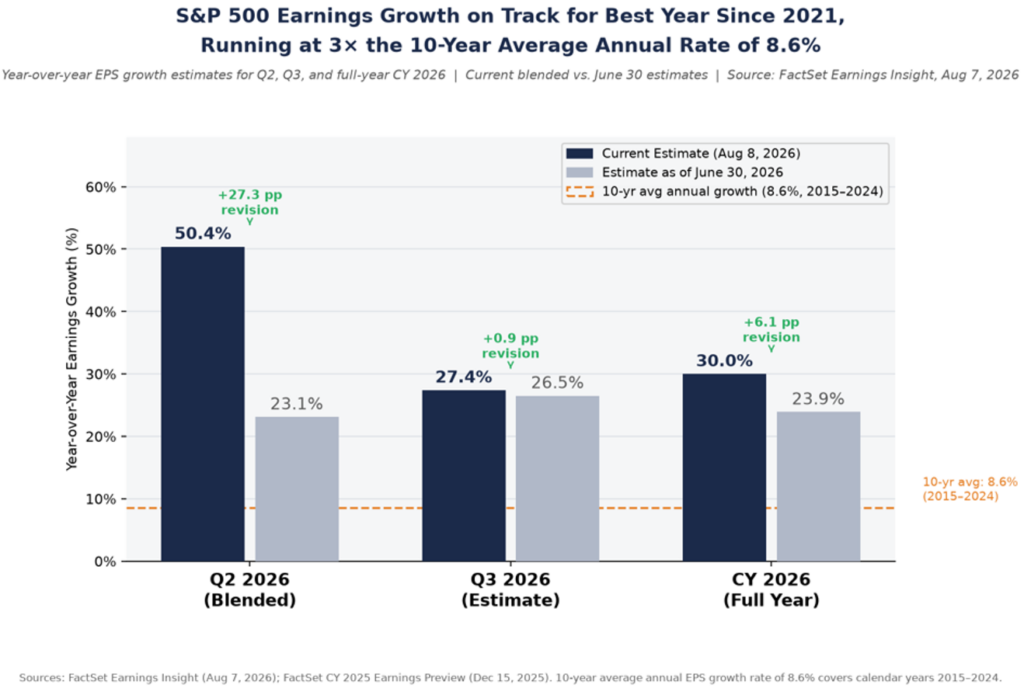
This earnings season has become difficult to describe without sounding overly enthusiastic. S&P 500 second-quarter earnings are now tracking more than 50% above last year.
At the end of June, expectations were closer to 23%.
Think about that.
We entered the quarter expecting excellent earnings growth, and companies have delivered results so strong that the growth estimate has more than doubled.
- Q3 earnings are currently expected to grow roughly 27%.
- Full-year 2026 earnings growth is running near 30%.
- The historical annual average is about 8.6%.
Those aren’t simply good numbers. They are unusual numbers. And this is where the valuation conversation needs a little more context.
We have talked for several years about elevated market valuations. That concern was legitimate and top of mind.
At various points, investors were paying more than 22 times forward earnings for the S&P 500, well above the longer-term average.
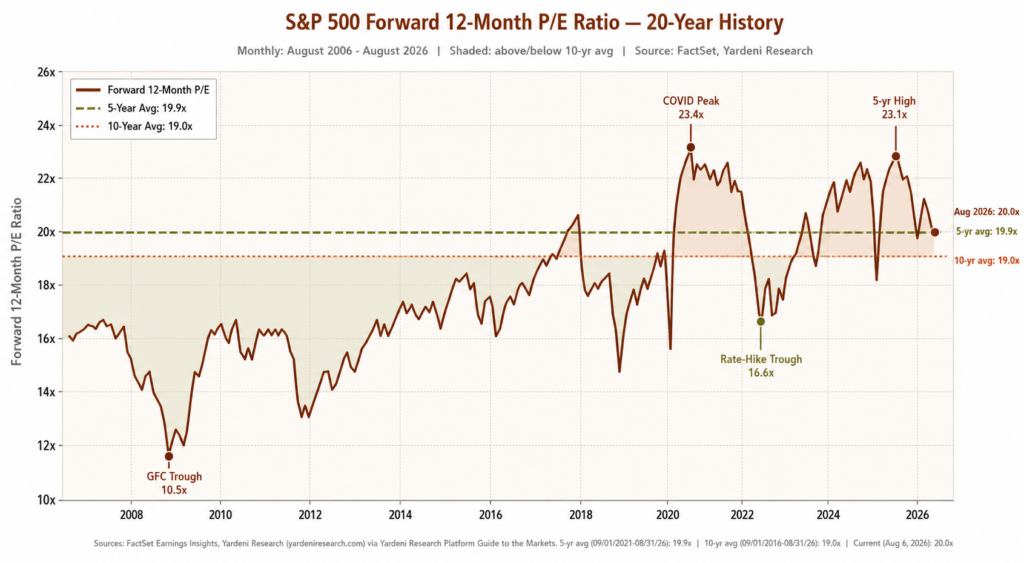
Today we are closer to 20 times earnings, still not cheap but also not nearly as extreme.
And the reason isn’t that stock prices have fallen; in fact they have risen.
Earnings have simply caught up.
This is one of those basic ideas that tends to get overlooked.
There are two ways a P/E ratio can decline.
The “P,” price, can fall.
Or the “E,” earnings, can rise.
Most investors instinctively think about valuation normalizing through falling prices. But when earnings are growing 20%, 30%, or even 50%, valuation can normalize while stock prices continue to rise.
Suppose the market goes up 10% and earnings rise 25%. The market just became cheaper.
That is essentially what extraordinary earnings growth allows to happen.
Maybe that is the part of this market we should spend more time thinking about. For the last several years, investors have been told that stocks were expensive, the consumer was about to crack, inflation would kill purchasing power, and eventually earnings would have to disappoint. There was always a perfectly reasonable reason to wait. The problem with waiting for everything to look comfortable is that markets rarely offer comfort at attractive prices.
There is something wonderfully irritating about that for the pessimist. The S&P 500 can make new highs and become cheaper at the same time. Earnings can grow faster than stock prices. A 20-times earnings market can normalize without ever giving investors the correction they’ve been patiently—or perhaps impatiently—waiting for.
And if earnings continue anywhere close to this pace, the uncomfortable possibility for investors sitting on the sidelines isn’t that stocks are too expensive. It’s that they may have been waiting for a sale while corporate America was busy earning its way out of one.
If you have questions or comments, please let us know. You can contact us via X and Facebook, or you can e-mail Tim directly. For additional information, please visit our website.
Tim Phillips, CEO, Phillips & Company
Sources & Data References:
Sources: U.S. Bureau of Labor Statistics, Employment Situation—July 2026; Bureau of Economic Analysis, Personal Income and Outlays—June 2026; FIFA, 2026 World Cup Schedule; FactSet, Earnings Insight, August 7, 2026; Yardeni Research. July payrolls fell 23,000, with weakness concentrated in local education and leisure and hospitality, while private payrolls still rose modestly. Core PCE inflation was 3.3% in June, roughly in line with wage growth. The World Cup concluded July 19, contributing to temporary hospitality distortions. Meanwhile, S&P 500 Q2 earnings growth reached 50.4%, helping forward valuations normalize toward recent historical averages.
The charts and data presented are sourced from a combination of public domain materials and licensed data providers. Their use is intended solely for educational and analytical commentary and falls within the scope of fair use. For a representative list of sources, please click here.
The material contained within (including any attachments or links) is for educational purposes only and is not intended to be relied upon as a forecast, research, or investment advice, nor should it be considered as a recommendation, offer, or solicitation for the purchase or sale of any security, or to adopt a specific investment strategy. The information contained herein is obtained from sources believed to be reliable, but its accuracy or completeness is not guaranteed. All opinions expressed are subject to change without notice. Investment decisions should be made based on an investor’s objective.