A Brief Word from Our Sponsor: Risk

It has been more than 552 days since we had a week when the markets corrected by 5 percent or more [i].
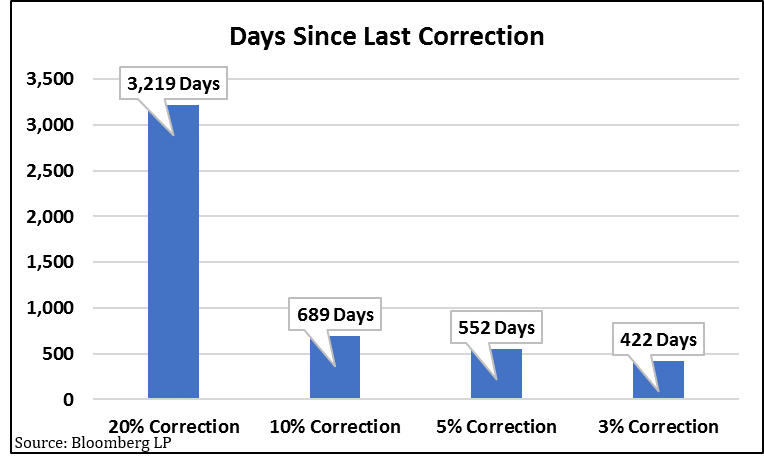
Recently, the S&P 500 finally experienced a slight pullback, and by the end of last week had corrected 3.9 percent. [ii] No surprise here, mainstream media made it out to be a cataclysmic event. Here are a few quotes from last Friday’s almost 700 point sell-off in the Dow Jones Industrial Average. [ii]
“Dow Industrials marks biggest weekly point setback in 9 years…” – Market Watch [iii]
“Stock market loses nearly $1 trillion on the week.” – CNBC [iv]
“U.S. stocks tumble as bond yields hit multiyear highs.” – Financial Times [v]
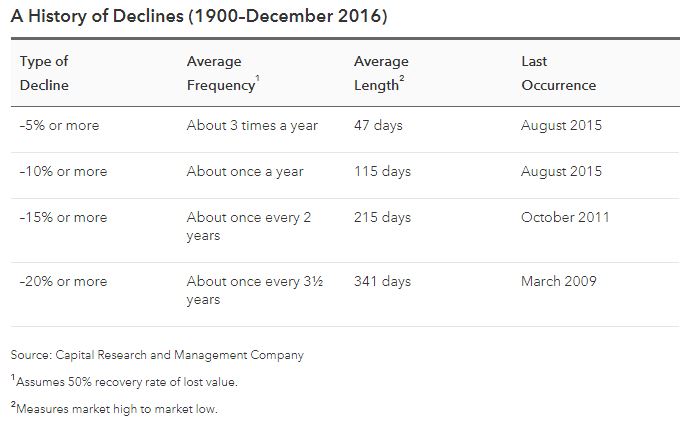
Despite what mainstream media does best - blowing things out of proportion - this market correction is quite normal and notwithstanding the past 500+ days, happens quite often. So far, the recent correction has represented only a 3.9 percent pullback and is well within the “normal” range [vi].
For many investors, this past year was similar to a lazy, breezy, cool summer day: not much to worry about. Last year the equity market returned 19.42 percent, with a balanced 60/40 (equity to fixed income) portfolio returning 14.44 percent [ii]. Compound these returns with the fact that investors have not experienced a 5 percent or 10 percent pullback in the market in nearly two years, and investors may forget that the engine that drives market returns is risk.
Needless to say, recent price action in the market has reminded us of this simple fact.
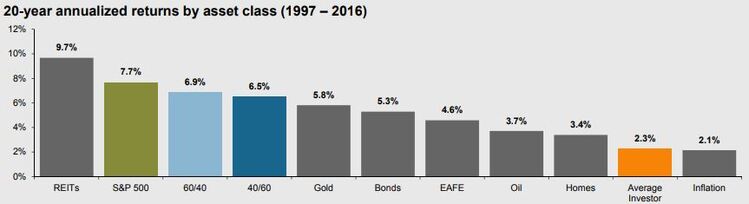
You may be asking yourself, “Why not time the markets if that is the case?” The simple answer is that if you are not perfect almost every time, you will likely miss all the advantage. In fact, you can see just how well the average investor performs relative to “buy and hold” strategies [vii].
Also, you can see that the “run of the mill” market corrections don’t last long.
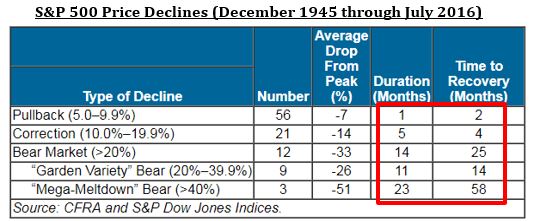
The duration of market declines is short, with recovery time often just as quick or in some instances even quicker than the correction itself [i].
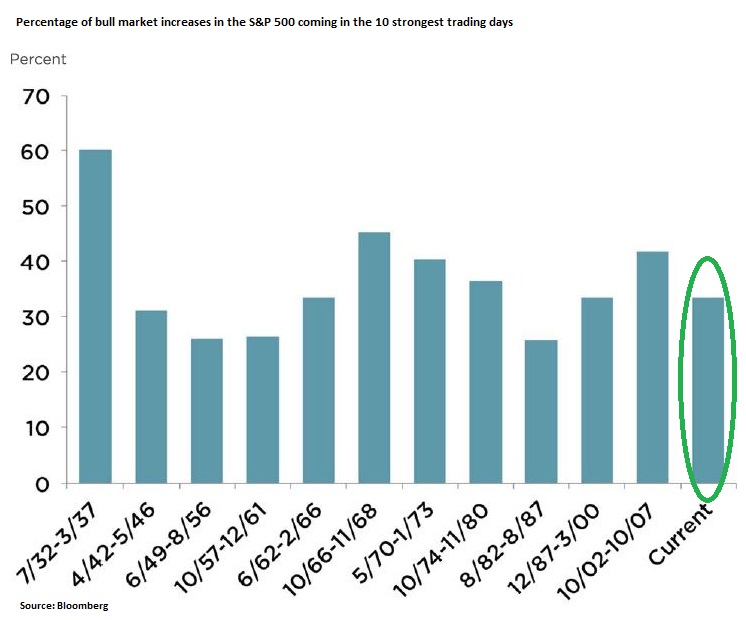
Furthermore, if you miss just a few critical days of investing, you can lose all the advantage of equity exposure in your portfolio. The fact of the matter is, on average the ten strongest days in a bull market have historically accounted for 36 percent of the gain across the cycle as a whole, with the top twenty-five days accounting for 73 percent of the gain [viii].
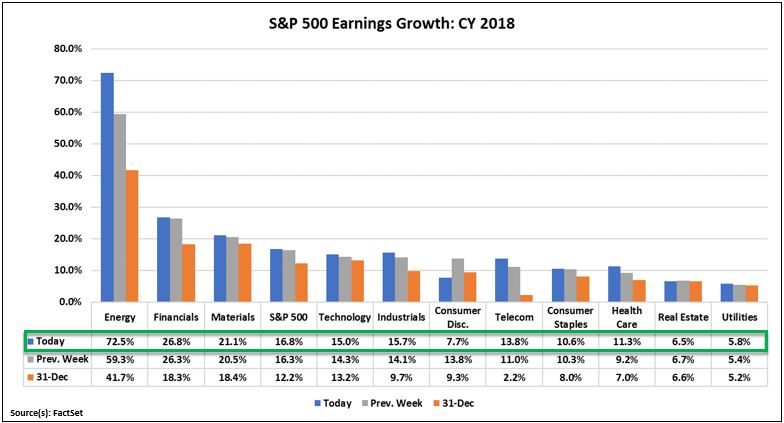
So, what has changed since last week’s market commentary by Phillips & Company? Just another round of earnings and upward revisions to expected earnings in 2018 [ix].
The other thing that has changed is interest rates. Interest rates have begun to rise at a more rapid rate, and they are anticipated to rise further throughout 2018. Higher rates can have a negative impact on the value of cash flows that investors receive from corporate earnings and dividends. This is certainly a possible risk to current equity prices and one that may be a contributor to the recent selloff.
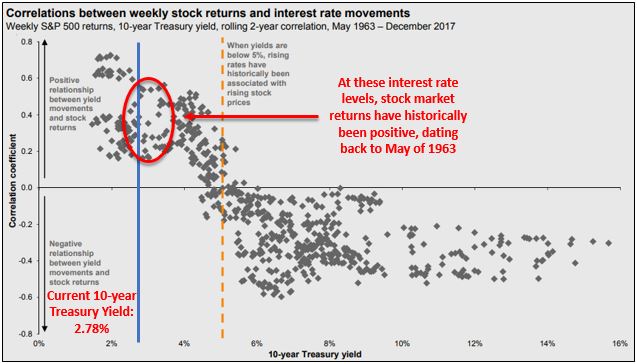
However, with interest rates still at historic lows, and the Federal Reserve signaling lower rates for longer, it is hard to justify pricing corrections in excess of 10 – 15 percent on U.S. equities at this time. In fact, at current interest rate levels, stock market returns have historically been positive [vii].
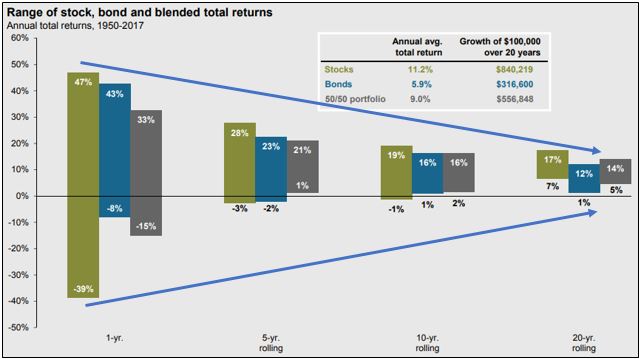
Needless to say, investors should ‘brace for impact’ as we suggested in our Q1 2018 Look Ahead. It is important to remember that risk is the fundamental co-conspirator when it comes to benefiting from equity returns. The best thing that investors can do is shape risk by using time [vii].
I encourage you to keep evaluating your time horizon, cash needs, and return profile. Perhaps this is a good time to do that again, as we are reminded that risk is our sponsor.
If you have questions or comments, please let us know. You can contact us via Twitter and Facebook, or you can email Tim directly. For additional information, please visit our website.
Tim Phillips, CEO, Phillips & Company
Robert Dinelli, Investment Analyst, Phillips & Company
References:
i. https://phillipsandco.com/files/9615/1519/3009/Look_Ahead_2018Q1_-_Final.pdf
ii. Bloomberg L.P.
iii. https://www.marketwatch.com/story/the-dow-industrials-have-tumbled-730-points-this-week-its-worst-point-loss-in-2-years-2018-02-02
iv. https://www.cnbc.com/2018/02/02/stock-market-loses-nearly-1-trillion-on-the-week.html
v. https://www.ft.com/content/889ffa88-07bd-11e8-9650-9c0ad2d7c5b5
vi. https://www.americanfunds.com/individual/planning/market-fluctuations/past-market-declines.html
vii. https://am.jpmorgan.com/blob-gim/1383407651970/83456/MI-GTM_1Q18_1.pdf?segment=AMERICAS_US_ADV&locale=en_US
viii. https://phillipsandco.com/files/3214/8399/3505/NFM-13126AO.pdf
ix. https://insight.factset.com/hubfs/Resources%20Section/Research%20Desk/Earnings%20Insight/EarningsInsight_020218.pdf