Alibaba and Amazon

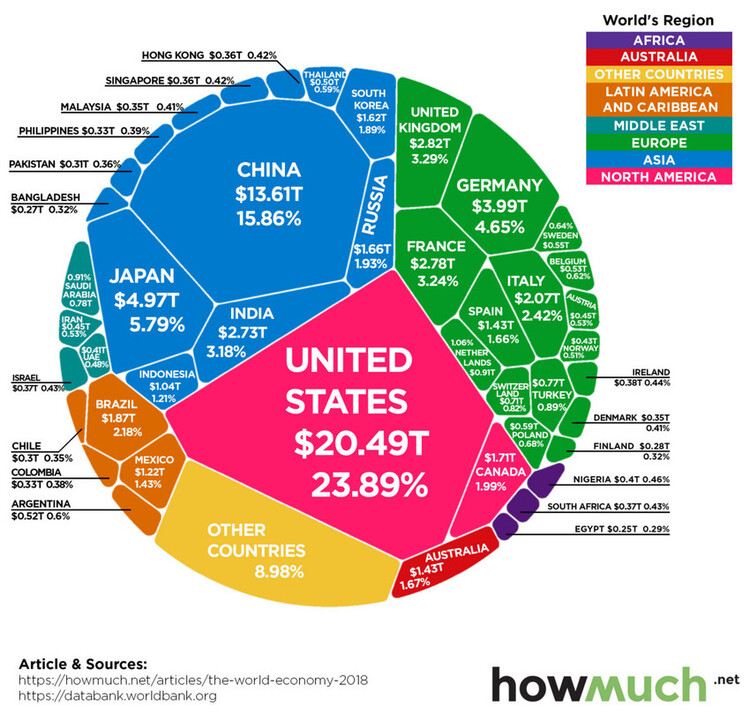
Last week gave us another look into the psyche of the consumer as the two largest economies in the world both reported strong retail sales. The combination of China and the United States make up almost 40% of global GDP, as shown in the infographic below. [i]
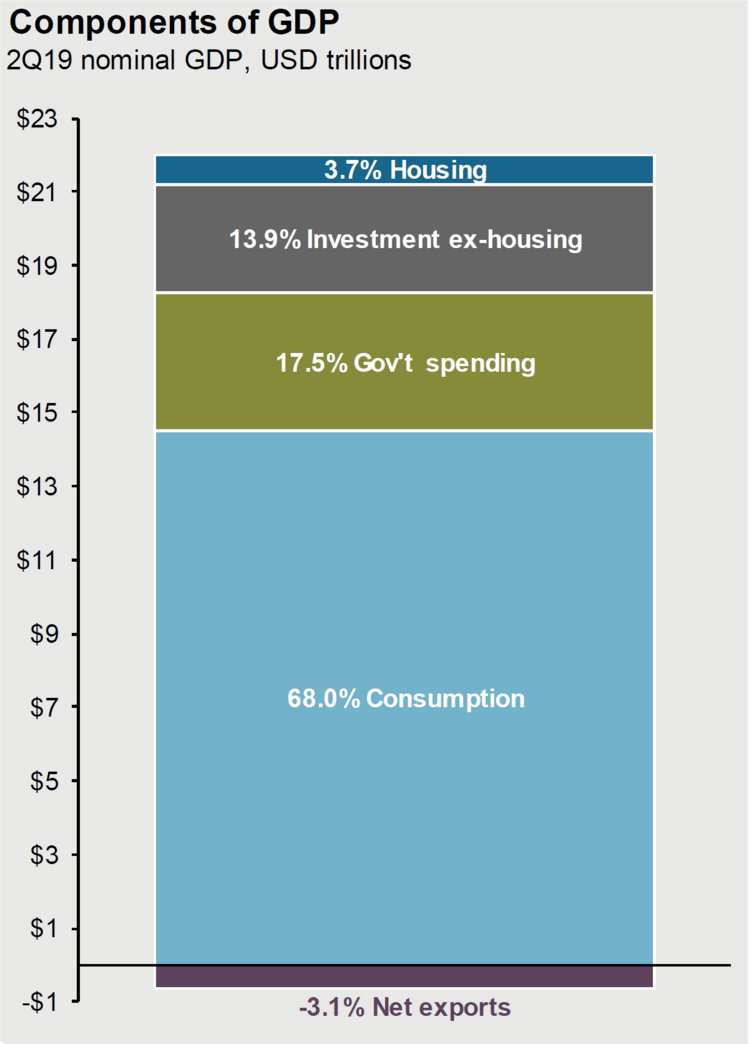
In looking at the composition of both China’s GDP and the United States’ GDP, we see that consumption now governs both countries. In the U.S., consumption makes up 68% of U.S. GDP. [ii]
In China, consumption has emerged as the predominant driving force of Chinese GDP. [iii]
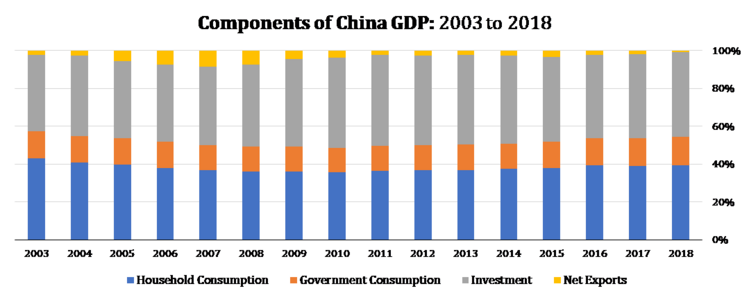
Both economies are now dominated by their respective consumers and therefore, global growth is highly dependent on these two drivers. Retail sales are a significant component of consumption and likely one of the critical indicators we should monitor, especially as we are in a very mature economic cycle.
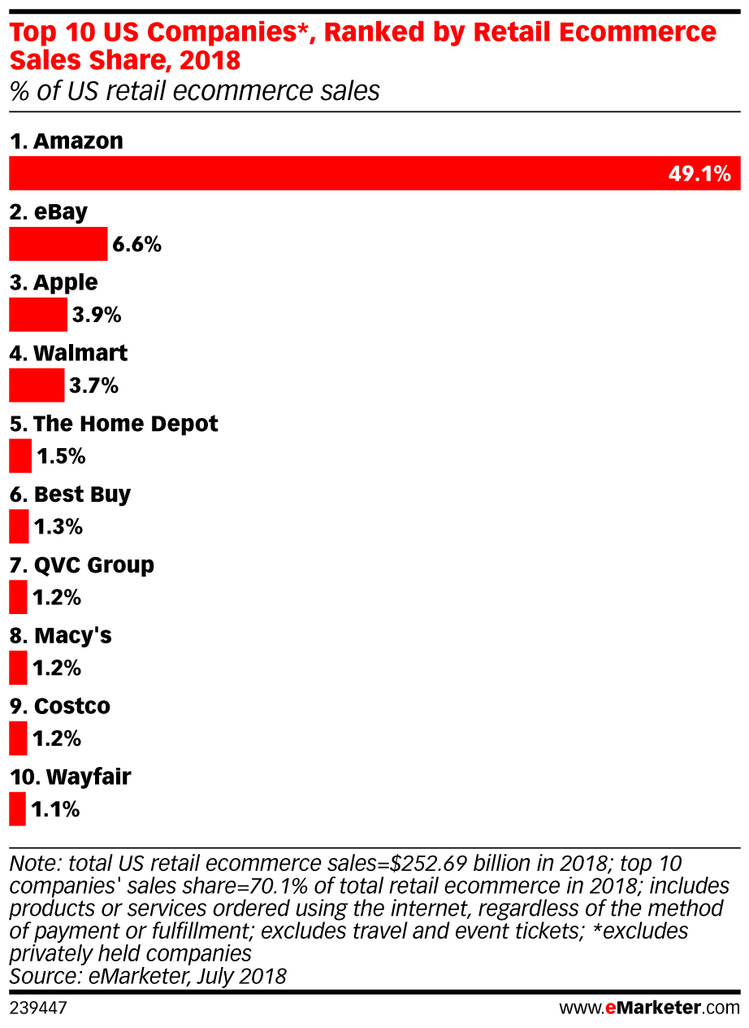
While total U.S. retail sales for October rebounded only modestly off the September lows, online retail sales grew substantially– likely driven by Amazon being the dominant U.S. retailer. [iv] [v]
Now let’s pivot to China: While global reaction toward their retail sales growth has been somewhat muted (+7.2% YoY), it is still nearly five times the U.S. growth rate. [vi]
Let’s also look at the massive response China experienced with their so-called “Singles Day” (the Chinese equivalent of Black Friday) which took place on November 11. Mainly driven by e-commerce giant Alibaba, Chinese shoppers bought $38.3 billion worth of goods, which was 26% higher than 2018. To put “Singles Day” in a different perspective, Alibaba alone sells more in one day than all U.S. retailers do on Black Friday and Cyber Monday combined. [vii]
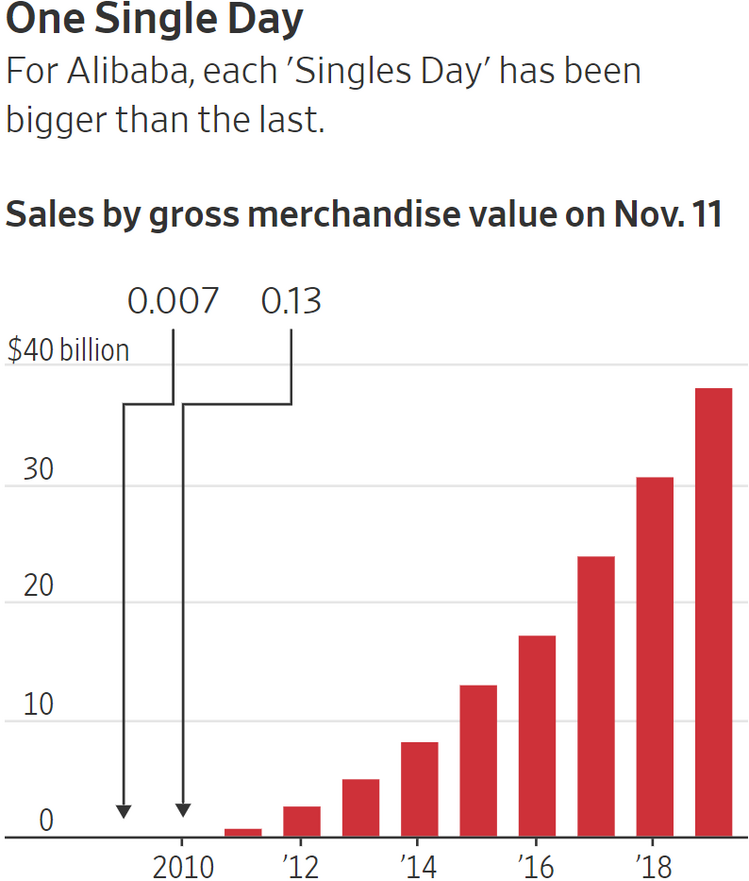
Retail sales are growing overall, but the online segment (Alibaba and Amazon) is dominating that growth. Let’s not bet against the consumer.
If you have questions or comments, please let us know. You can contact us via Twitter and Facebook, or you can e-mail Tim directly. For additional information, please visit our website.
Tim Phillips, CEO, Phillips & Company
Sources:
i. https://foreignpolicy.com/2017/02/24/infographic-heres-how-the-global-gdp-is-divvied-up/
ii. https://am.jpmorgan.com/us/en/asset-management/gim/adv/insights/guide-to-the-markets
iii. http://data.stats.gov.cn/english/easyquery.htm?cn=B01
iv. https://media.bespokepremium.com/uploads/2019/11/B.I.G.-Tips-Retail-Sales-Rebound.pdf