Are Stock Values Elevated? How Long Can This Last?

Are stocks overvalued? By the conventional wisdom, the answer is a resounding Yes! When you look at various valuation metrics, stocks look overvalued on a 5-year and 10-year basis. [i]
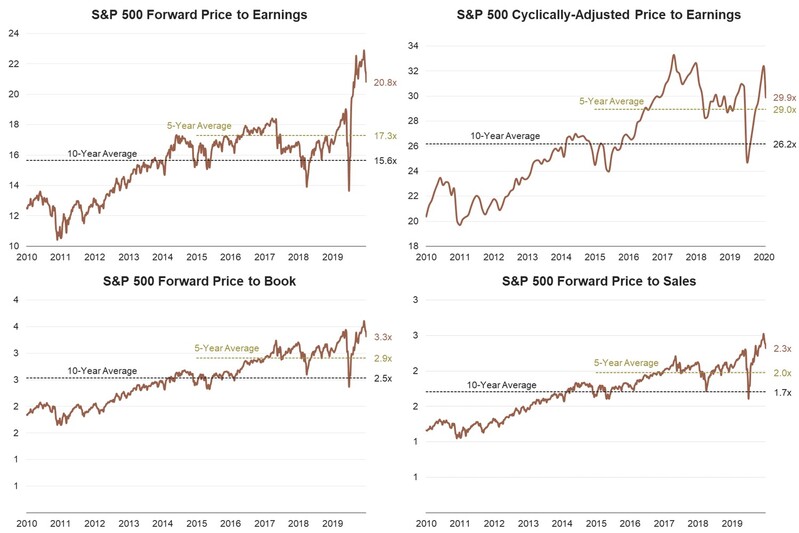
Before I just wrap this post up and conclude equities are overvalued, it is important to look at a few other factors before we all run for cover.
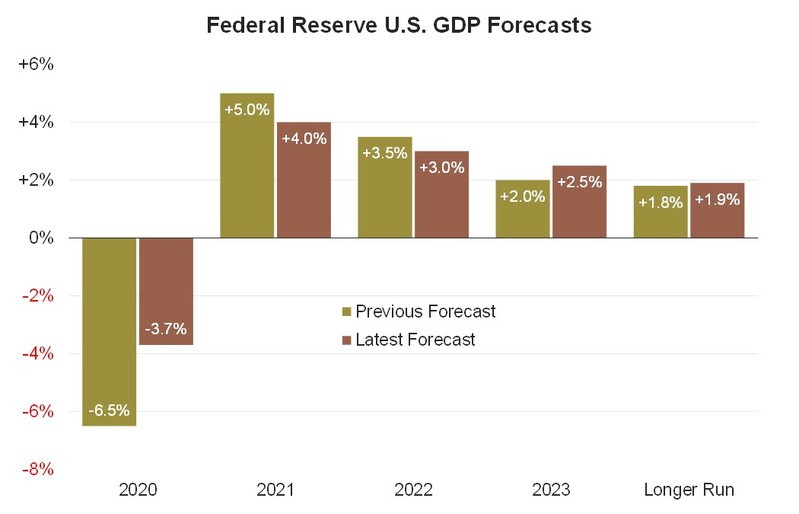
The Fed recently upgraded their U.S. GDP forecast, going from a decline of 6.5% in 2020 to a decline of 3.7%. That’s an improvement of 43%. To be complete, they also reduced their 2021, 2022, and 2023 forecasts modestly. [ii]
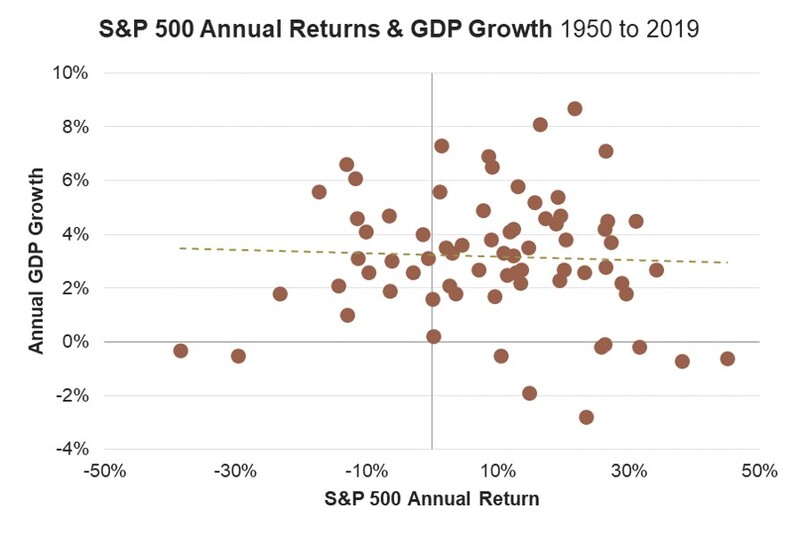
It’s important to note GDP growth and equity valuations are correlated for the most part. Improving GDP growth may be reflected in current equity prices. [iii] [iv]
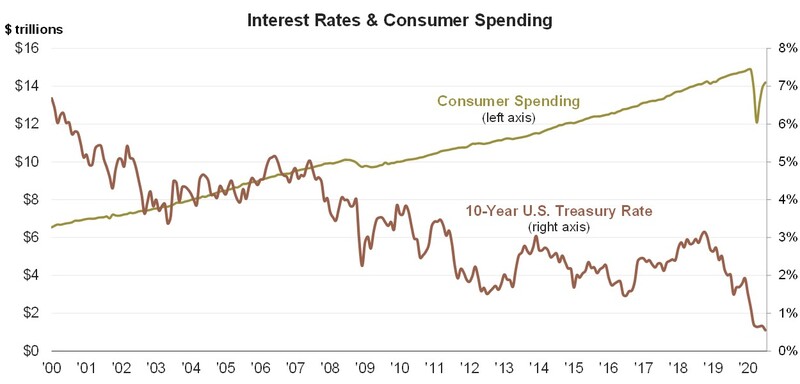
The second factor is, again, related to interest rates. The most recent statement from the Federal Reserve suggests the central bank does not plan on raising rates until the economy tracks closer to full employment and inflation is running modestly in excess of 2%. [v]
Lower rates generally drive higher equity valuations. Why? Lower rates anecdotally drive more consumer spending. [vi]
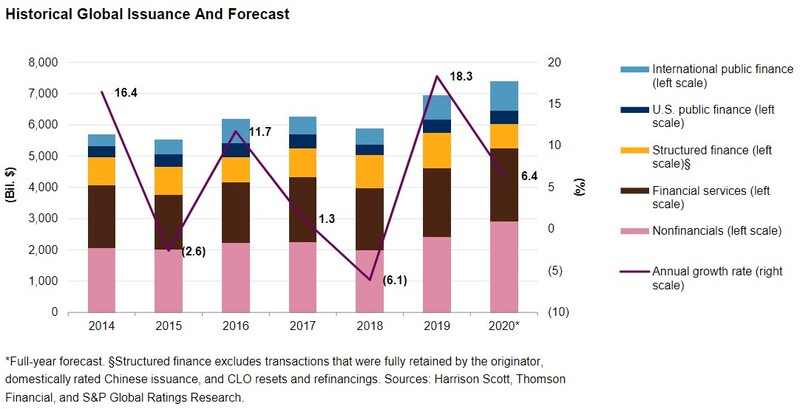
Lower rates usually drive lower cost of capital for companies that borrow, in turn dramatically improving profitability. In fact, with record U.S. corporate borrowing, a drop of 100 basis points in corporate debt service could lead to $67 billion per year in profits. [vii]
Third, for those old school valuation people like myself, lower rates improve the discounted cash flow models used for valuation. The math is quite simple: You and I buy a stream of future cash flows when we buy stock. We discount those streams back to current day using a discount rate that is consistent with both the riskiness and the type of cashflow being discounted (usually a bank lending rate of some fashion). When those rates drop you take a much smaller discount on those cash flows and that improves valuation drastically.
Tying all of this together, here’s a real-world scenario:
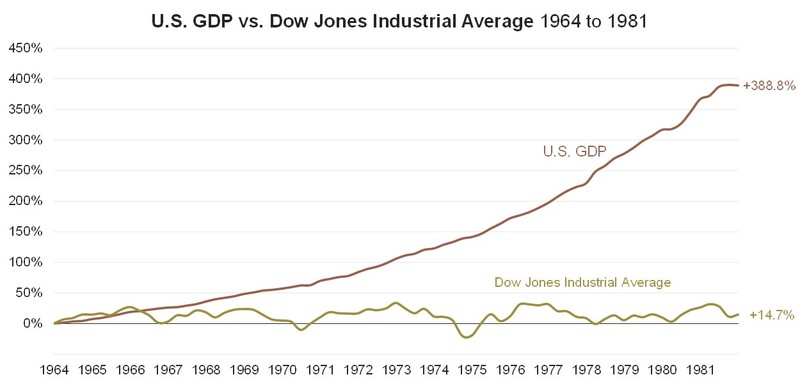
From 1964 to 1981, the stock market went basically nowhere. In total, very little money was made by investors during this period. But yet, GDP nearly quadrupled. [iii] [viii]
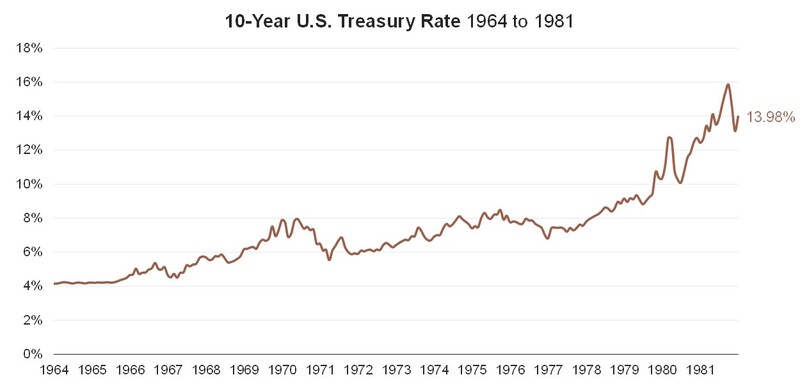
How is this possible you may ask? Well, interest rates rose dramatically during this period. The rate on long-term government bonds went from a mere 4.14% in 1964 to 13.98% by 1981. [ix]
This had a devastating effect on stock prices. Then―as we are well aware―from 1981 to 1998 stocks rose almost tenfold. [vii]
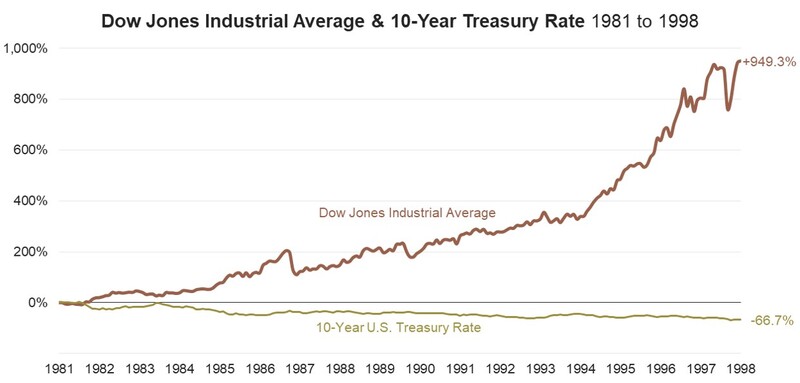
This can easily be explained by the remarkable decline in interest rates―all the way from that 14% in 1981 to below 1% at the start of this decade. [ix] Notably, GDP growth was actually lower in this second period than it was in the first. [iv] This is why Warren Buffett argued in 1999 that stocks could not perform as well in the subsequent 17 years as it had in the previous.
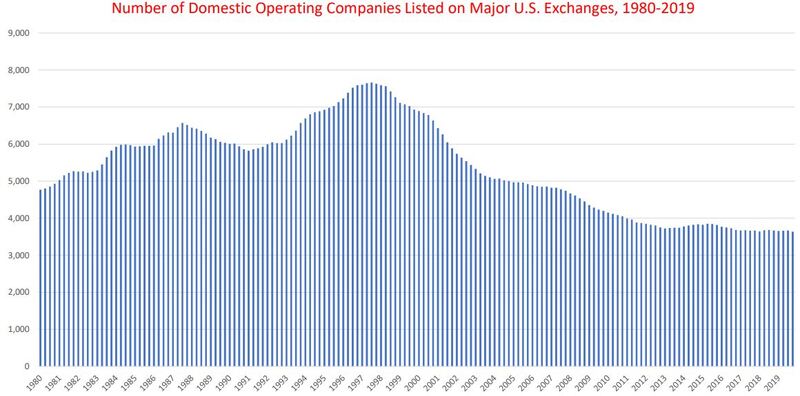
Another trend that can hold valuations much higher is the shrinking of our stock market. There are fewer shares traded today on fewer companies than in the past. The number of listed companies in the U.S. has shrunk roughly 38% since 1997. It is simple supply and demand. [x]
Are equity valuations elevated? That seems obvious on the sheer merits. However, there are forces that may keep U.S. equity valuations elevated for a longer period of time than most might anticipate.
To see our latest Thought Leadership conversation with Kevin Xu, our China technology expert, please click here to watch the replay. We think you will find it informative.
If you have questions or comments, please let us know. You can contact us via Twitter and Facebook, or you can e-mail Tim directly. For additional information, please visit our website.
Tim Phillips, CEO, Phillips & Company
Sources:
i. https://www.bloomberg.com/quote/SPX:IND
ii. https://www.federalreserve.gov/monetarypolicy/fomcprojtabl20200916.htm
iii. https://www.spglobal.com/spdji/en/indices/equity/sp-500/#data
iv. https://fred.stlouisfed.org/series/GDP
v. https://www.federalreserve.gov/newsevents/speech/powell20200827a.htm
vi. https://fred.stlouisfed.org/graph/fredgraph.png?g=w1JB
vii. https://www.spglobal.com/ratings/en/research/articles/200727-credit-trends-global-financing-conditions-bond-issuance-is-expected-to-finish-2020-up-6-after-a-strong-sec-11584612
viii. https://www.spglobal.com/spdji/en/indices/equity/dow-jones-industrial-average/
ix. https://fred.stlouisfed.org/series/DGS10
x. https://site.warrington.ufl.edu/ritter/files/Listed_19802019.pdf