Are We Better Off?

Ten years ago, on September 15, 2008, Lehman Brothers filed for bankruptcy. That event symbolized the ultimate consequence of excessive lending by banks. [i]
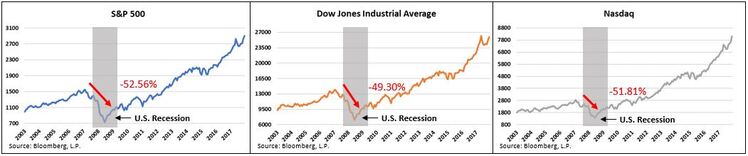
Over the period to follow, known as the “Great Financial Crisis,” the three major U.S. stock market indices—the S&P 500, the Dow Jones Industrial Average, and the Nasdaq—saw their values decline by roughly half. [ii]
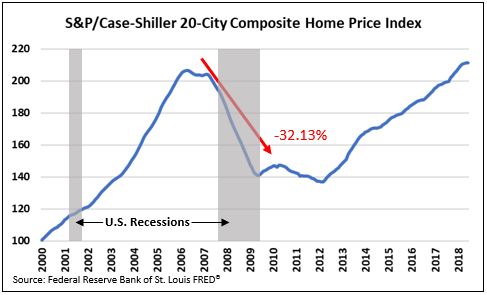
Over the same period, as many remember, housing prices plummeted and foreclosure rates skyrocketed. In fact, the Shiller Home Price Index, which tracks residential home prices in 20 major metropolitan cities, fell 32.1 percent. [iii]
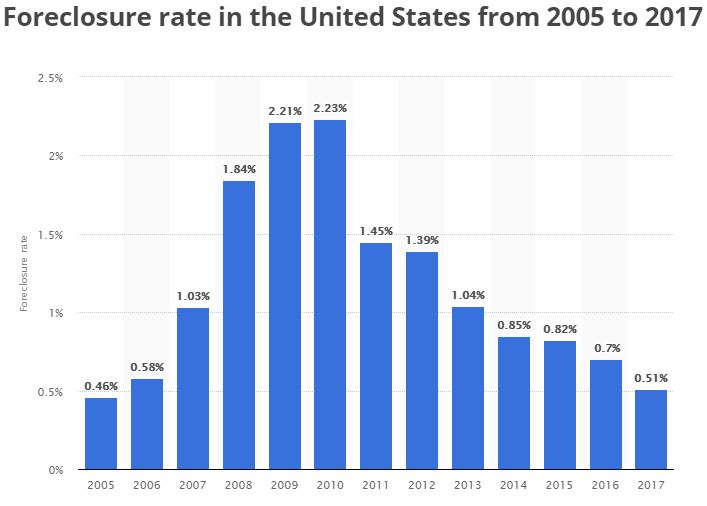
At the same time, the U.S. foreclosure rate more than doubled its 2007 levels, which led to roughly 7 million American’s losing their homes. [iv] [v]
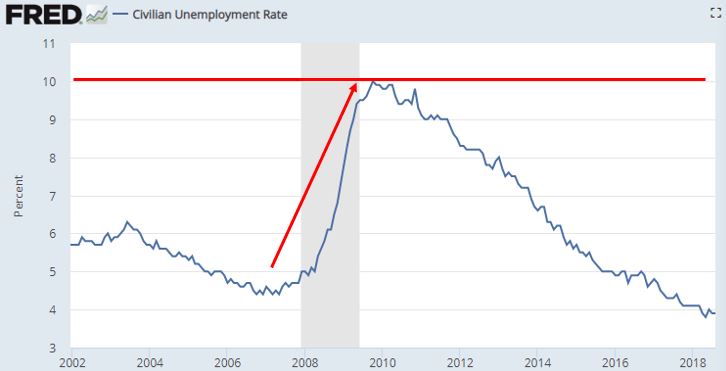
But that wasn’t all. The Great Financial Crisis caused 8.7 million jobs to be lost, sending the unemployment rate to 10 percent. [vi] [vii]
I doubt that there is any dispute, but I believe that we’re better off today than we were 10 years ago.
But the question that remains is whether we are better positioned today than we were 10 years ago to withstand another credit-induced crisis.
It may be hard to believe we might see another credit-induced crisis, but the fact is we’ve seen eight such events over the past 40 years—on average, that’s one event every five years. [viii]
Considering we haven’t experienced a credit-induced crisis in nearly 10 years, it’s worth examining how the U.S. looks today relative to how the U.S. looked just before the Great Financial Crisis of 2008. Perhaps we can gain some insight into how the U.S. may fair if faced with another such crisis.
There are five areas that are worth examining: student loans, subprime auto loans, subprime mortgages, bank capital reserves, and the consumer’s balance sheet.
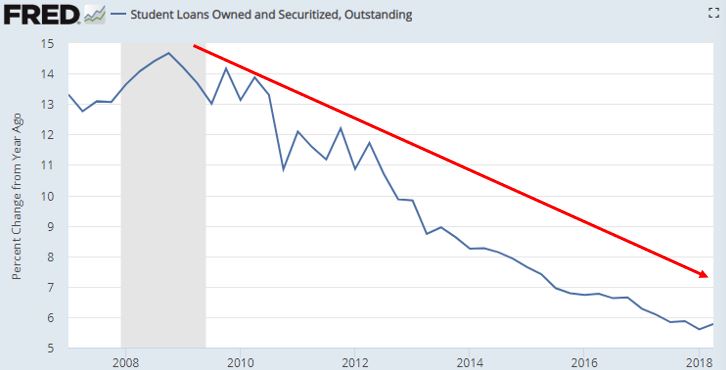
First, we’ll look at student loans outstanding. While it’s no secret that the overall level of student loans outstanding has more than doubled to $1.4 trillion since 2008, the rate at which outstanding student debt is growing has slowed dramatically from its growth rate of 14.2 percent to 5.8 percent. [ix]
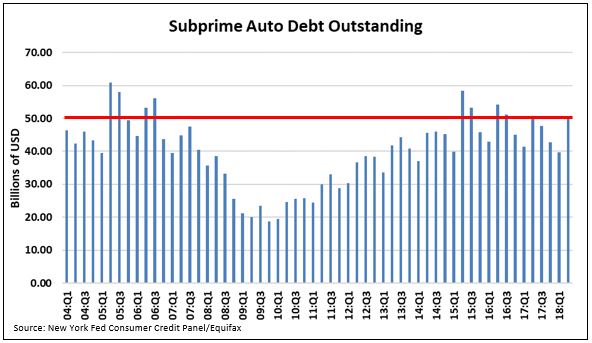
Next, we’ll look at subprime auto loans, an area we have examined many times. It’s worth noting that the current levels are roughly in line with where we were prior to the last credit-induced crisis. However, before the financial crisis of 2008, nearly 50 percent of all auto loans issued were considered subprime, whereas today it’s 30 percent. [x]
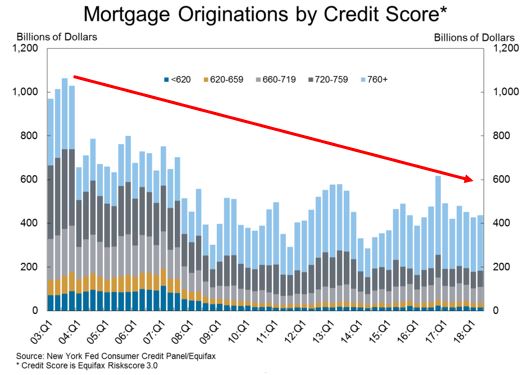
Subprime mortgages were another primary contributor to the 2008 recession. As you can see from the chart below, not only has mortgage origination as a whole remained relatively low compared to pre-financial crisis levels, but the majority of mortgages have been to borrowers with credit scores above 760. Currently, subprime mortgages remain a fraction of what they were prior to 2008. [x]
Banking capital was another factor that contributed to the near collapse of the U.S. financial system. By the looks of it, that situation has improved dramatically.
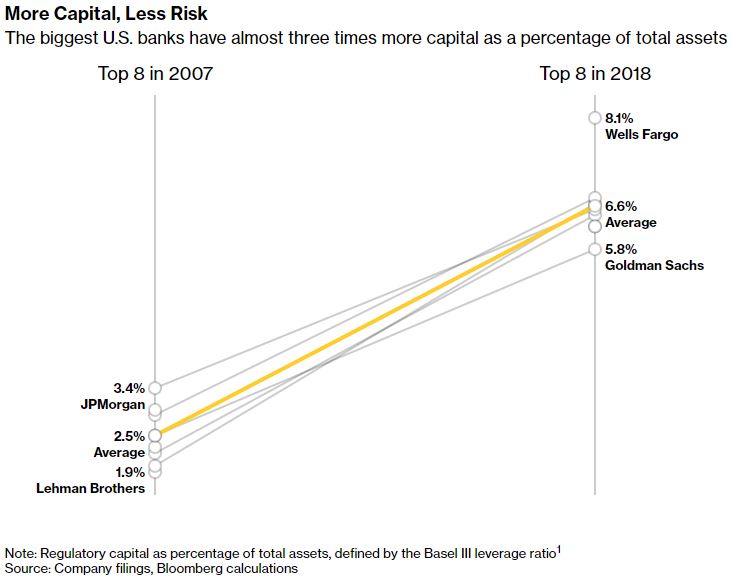
As you can see, the largest U.S. banks are sitting on a considerable amount of capital relative to their total asset base today. [xi]
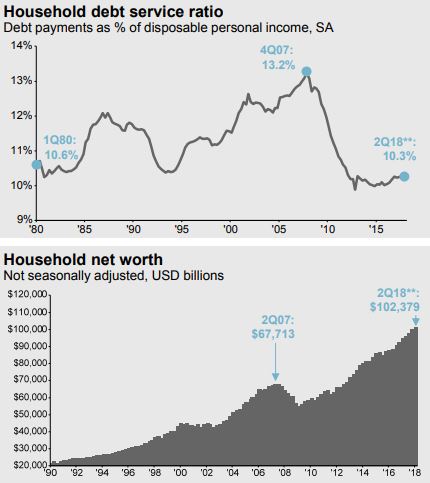
And last, the consumer’s balance sheet appears to be stronger than ever. Household net worth has increased 52 percent since 2007 while the household debt service ratio has fallen almost 22 percent. [xii]
By the looks of it, Americans are clearly better off than they were prior to the Great Financial Crisis. There are fewer subprime auto loans and fewer subprime mortgages today. Additionally, the U.S. consumer has a far stronger balance sheet alongside a far healthier banking system than was the case in 2008. While the growing student loan debt may be the biggest bubble of all, on average, we look to be in better shape than we were in 2008.
If you have questions or comments, please let us know. You can contact us via Twitter and Facebook, or you can e-mail Tim directly. For additional information, please visit our website.
Tim Phillips, CEO, Phillips & Company
Robert Dinelli, Investment Analyst, Phillips & Company
References:
i. https://www.investopedia.com/articles/economics/09/lehman-brothers-collapse.asp
ii. Bloomberg, L.P.
iii. https://fred.stlouisfed.org/series/SPCS20RSA#0
iv. https://www.statista.com/statistics/798766/foreclosure-rate-usa/
v. https://blog.credit.com/2015/04/boomerang-buyers-is-there-homeownership-after-foreclosure-114803/
vi. https://fred.stlouisfed.org/series/UNRATE
vii. https://www.cbpp.org/research/economy/chart-book-the-legacy-of-the-great-recession
viii. http://www.ifre.com/a-history-of-the-past-40-years-in-financial-crises/21102949.fullarticle
ix. https://fred.stlouisfed.org/series/SLOAS
x. https://www.newyorkfed.org/medialibrary/interactives/householdcredit/data/pdf/HHDC_2018Q2.pdf
xi. https://www.bloomberg.com/graphics/2018-lehman-anniversary/?cmpid=socialflow-twitter-business&cmpid%3D=socialflow-twitter-politics
xii. https://am.jpmorgan.com/blob-gim/1383407651970/83456/MI-GTM_3Q18_linked.pdf?segment=AMERICAS_US_ADV&locale=en_US