As Good As It Gets
Let’s start this week’s post with a quote from the University of Michigan Consumer Surveys’ chief economist, Richard Curtin:
“Consumer sentiment surged in early October, reaching its highest level since the start of 2004. The October gain was broadly shared, occurring among all age and income subgroups and across all partisan viewpoints. The data indicate a robust outlook for consumer spending that extends the current expansion to at least mid 2018, which would mark the 2nd longest expansion since the mid 1800's.” [i]
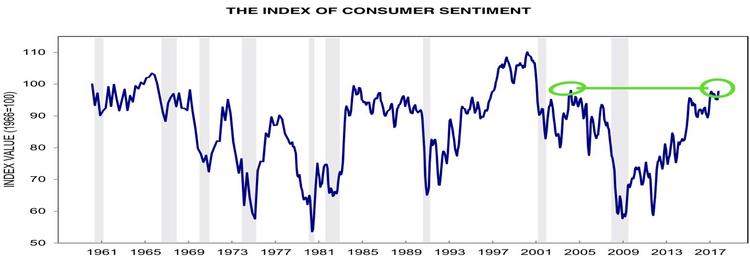
Here are the key takeaways from the above graph of the Index of Consumer Sentiment:
- Consumer sentiment has reached its highest level since 2004 [ii]
- Current sentiment levels are indications that the current expansion may extend to the middle of 2018. [i]
- If the current expansion extends to mid-2018, it would be the second longest expansion since the mid-1800s – it’s rare to be able to go back to the mid-1800’s for any data reference [i]
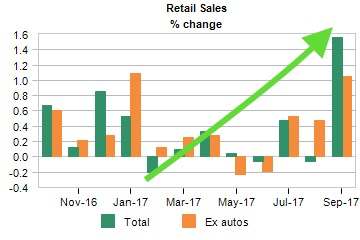
There’s no mistaking that the U.S. consumer is on fire. That’s not just evidenced by the Index of Consumer Sentiment: you can see it clearly in the resurgence of U.S. retail sales, which posted strong gains this week [iii]
.
Is this as good as it gets? Our simple answer is no. Based on the amount of debt service payments as a percent of disposable income, U.S. consumers have ample room to increase their purchasing power before even coming close to reaching pre-financial crisis levels. [iv]
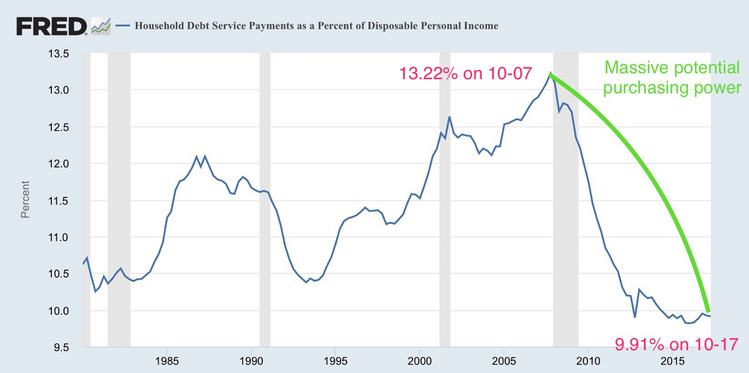
If you measure the actual dollars that can be borrowed for spending to return the consumer back to the peak in October 2007, assuming an 8% borrowing rate and a 10-year time horizon, it would amount to approximately $5.9 trillion in spending over the next 10-years. [v]
Based on a conservative U.S. GDP annual growth rate of 2%, this $5.9 trillion of added consumption over the next 10-years could add an additional 1.72% per-year to annual GDP growth. [vi]
Let’s pretend that the U.S. consumers have learned their lesson from excess borrowing during the financial crisis (although we doubt it). If they increase their borrowing to 11.57% of disposable household income (midpoint between current and October 2007 levels), that could add an additional 0.90% per-year to GDP growth over the next 10 years. [vi]
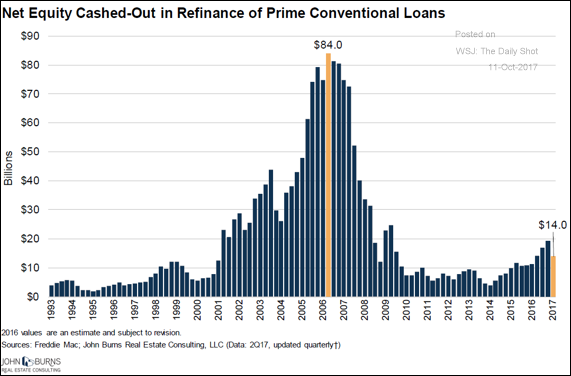
In fact, some of the most aggressive credit already appears to be expanding again. Cash-out home equity loans are on the rise, though there is still much more room to rise before reaching peak pre-financial crisis levels from 2006 (note that the $14 billion is a year-to-date number through October 2017 indicating that there could be more expansion before year’s end). [vii]
From an investor’s perspective, these credit increases are translating into U.S. and global equity earnings growth expectations. [viii]
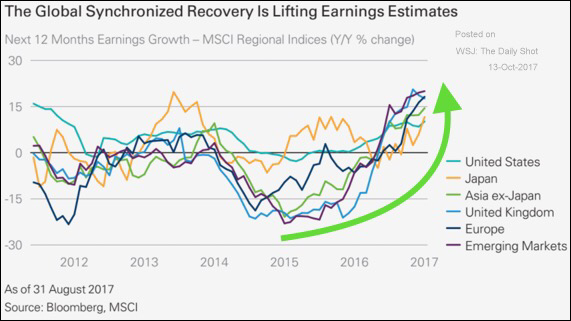
Nevertheless, this optimism does not preclude the possibility of a market correction, which is long overdue. We also caution that this data does not suggest that companies can continue to meet rising expectations for earnings-per-share growth.
However, with fuel in the tank, things are likely far from as good as they get for the U.S. consumer.
If you have questions or comments, please let us know. You can contact us via Twitter and Facebook, or you can e-mail Tim directly. For additional information, please visit our website.
Tim Phillips, CEO, Phillips & Company
Robert Dinelli, Investment Analyst, Phillips & Company
References:
i. http://www.sca.isr.umich.edu/
ii. http://www.sca.isr.umich.edu/files/chicsh.pdf
iii. https://www.economy.com/dismal/indicators/releases/usa_retail/United-States-Retail-Sales
iv. https://fred.stlouisfed.org/series/TDSP
v. https://fred.stlouisfed.org/series/DSPI; PV of a 10-year loan, 8% cost of capital, with annual debt service payments of 13.22% of Disposable Personal Income (Q2 2017 - $14,351.50),
vi. Current GDP of $18.57T - https://data.worldbank.org/indicator/NY.GDP.MKTP.CD?name_desc=false
vii. https://thejanusobserver.com/
viii. http://econintersect.com/pages/contributors/contributor.php?post=201710160113