Do Valuations Matter Anymore?
Last Friday's strong jobs report, as well as several solid earnings announcements, led to the best trading day of 2017. Given the action in the markets since the election this past November, one must question, “How overvalued can this market get before we see a repricing of risk?”
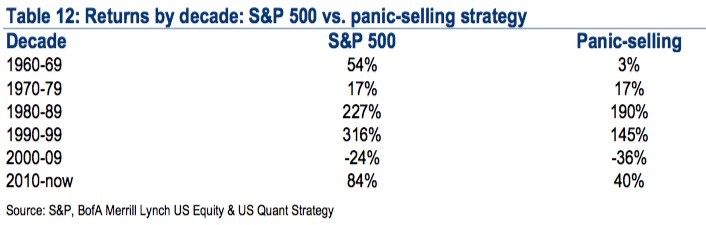
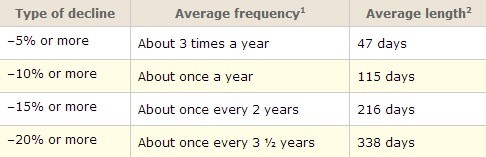
Before I attempt to answer that question, let me soundly dispel a common myth among the markets. Neither you, nor I, nor anyone else, can successfully time the market over any sustainable period of time. In fact, those that try, typically give up most of the benefits of investing in equity markets. Below is a table that shows what happens when you sell on a 2% down movement versus riding through. In only one period (1970-1979) would you be about even with a buy and hold strategy. Keep in mind that does not include any tax or commissions you might have paid in such a panic selling mode.
With that word of caution, let's look at how valuations look today.
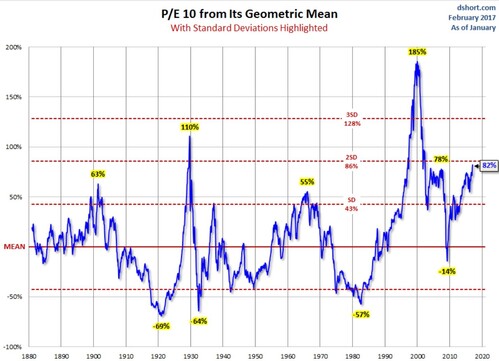
The S&P 500 is trading at a 10-year, inflation-adjusted PE of 28.5 [i], or 82%, above the mean; that's up nearly 2 full standard deviations [ii]. This could lead investors to panic sell on a normal correction, or any small pullback. There are some reasons that support the markets move to even higher valuations.
Markets can trade well above the average longer than expected:
Looking at the mid-1990's period of time on the same chart, you can see that if you sold at the same valuation, you would have missed out from an extra 176% return that occurred over the next 4 years. [iii]
The U.S. macroeconomic conditions suggest no recession in 2017:
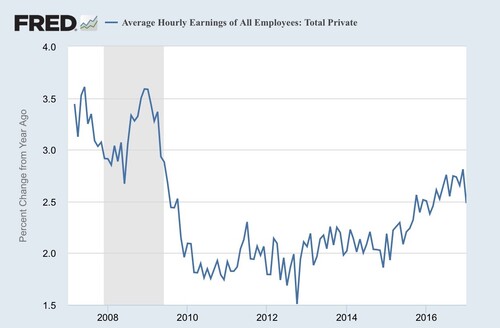
Wages are up 2.5% from this time last year. [iv]
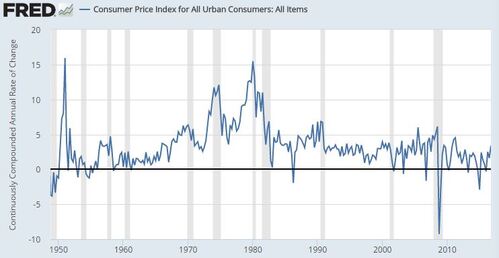
Inflation expectations by the Fed have reached target levels. [v]
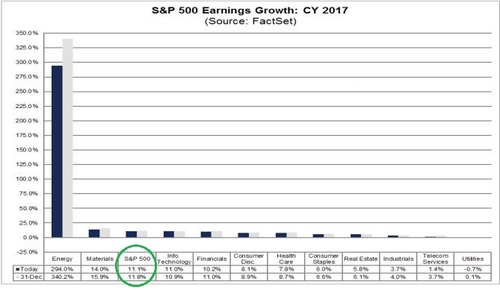
Corporate earnings per share are expected to grow by 11% this year. [vi]
A transition from monetary policy (interest rate cuts) to fiscal policy (tax cuts and infrastructure spending) is in motion and would underpin a late cycle economic expansion.
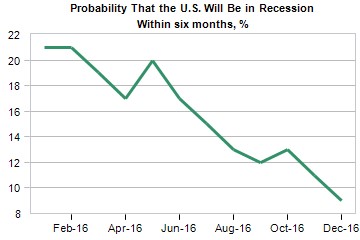
The risk of recession is at lows we have not seen since 2010. [vii]
Household balance sheets are very strong, which demonstrates tremendous deleveraging over the last 9 years. [i]
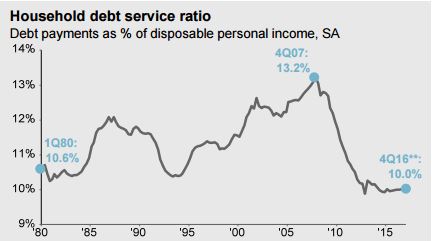
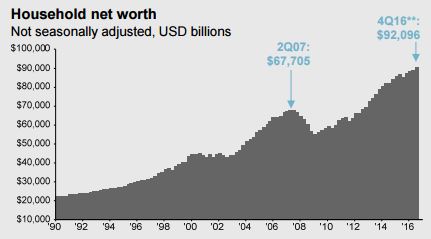
This allows for a consumer to increase consumption tendencies in the late stages of this recovery.
With the likelihood that returns may be muted going forward, and the uncertainty surrounding a host of unpredictable risks with the new administration, it's hard to see how selling out of the market now, in hopes of defending against the downside, remains the best strategy.
That being said, I must remind our readers that corrections are very common occurrences in the regular course of equity investing. [viii]
I certainly expect 2017 to be no exception to that trend; however, valuations could trend higher from here.
If you have questions or comments, please let us know as we always appreciate your feedback. You can get in touch with us via Twitter, Facebook, or you can email me directly. For additional information on this, please visit our website.
Tim Phillips, CEO – Phillips & Company
Robert Dinelli, Investment Analyst – Phillips & Company
References:
i. https://phillipsandco.com/files/3414/8640/4305/MI-GTM_1Q17_February.pdf
ii. https://www.advisorperspectives.com/dshort/updates/2017/02/01/is-the-stock-market-cheap
iii. Bloomberg, LP.
iv. https://fred.stlouisfed.org/series/CES0500000003
v. https://fred.stlouisfed.org/series/CPIAUCSL
vi. https://phillipsandco.com/files/7814/8640/3166/EarningsInsight_020317.pdf
vii. https://www.economy.com/dismal/indicators/releases/usa_recession
viii. https://investment-fiduciary.com/2011/08/05/how-often-do-market-corrections-happen/