Do We Bet Against Bad Behavior?
Last week, we touched on a report from the Economic Cycle Research Institute (ECRI) that calls for the United States to enter a recession in 2012. This deserves further examination for two reasons. First, it’s a significant outlier from other 2012 GDP forecasts. Second, they’ve correctly called three recessions without any false alarms in-between.

The ECRI’s call is based on a number of leading indices which a key piece is their view on the United States Gross Domestic Income (GDI). GDI is similar to GDP conceptually in that it adds up a set of economic components. GDI is different from GDP in that it adds up economic components from the other side of the equation. In other words, GDP gauges the economy from the expenditure side, while GDI gauges the economy from the income side. In theory, the two should be equal but are usually not because in practice they are calculated in different ways. Where GDP is the sum of consumption, investments, government spending and net exports; GDI is calculated based on employee wages, corporate profits, and tax revenues. Looking at our economy based on income is fairly intuitive as income drives consumption and 70% of our economy is driven by consumption.
According to the ECRI the last reading on GDI was 0.30%. This is much lower than GDP which came in at 2.0% down from the initial reading of 2.5%. The ECRI goes on to explain that when you have a two quarter annualized GDI growth rate of 2% or lower, you reach a recessionary stall speed. The last reading was 0.28% and has been trending down steadily.
Looking past the troubling GDI data there are still a couple of interesting data points on what consumers are doing with their income.
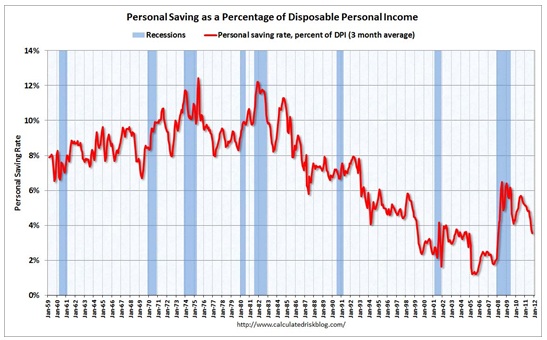
First, according to the Bureau of Economic Analysis, income increased faster than spending and the savings rate increased slightly:
Personal saving -- (disposable personal income) DPI less personal outlays -- was $400.2 billion in October, compared with $376.9 billion in September. Personal saving as a percentage of disposable personal income was 3.5 percent in October, compared with 3.3 percent in September.
The savings rate ticked up in October, however, the trend still appears to be going lower. Consumers appear to be feeling more confident because they are more willing to spend down savings in order to consume.

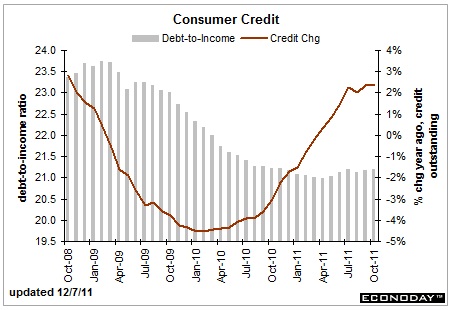
Second, consumers have been using more revolving and non-revolving credit in the last couple of months to increase consumption.

As for companies, they are sitting on $2.11 trillion in cash. When you put this in terms of the total assets on their balance sheet – cash on the sidelines – it’s at a 30 year high. After all, many non-financial companies were frozen out of the debt and overnight lending markets by banks which almost collapsed their businesses. However, there will come a point when they deploy this cash for higher returns.

Last but not least, corporations have had another banner quarter of record earnings which we did discuss last week.
So while the GDI data suggests gross income for our country is down, the consumer is still finding ways to consume. Maybe it's just in our behavior to consume and we can't help ourselves. Perhaps our consumption is unsustainable and we will fall back into a recession. No one really knows what next year holds and the best bet is to tailor your investment strategy based upon shaping risk with time and allocating accordingly.
I for one wouldn’t want to bet against the consumer demonstrating unsustainable habits because history has shown how resilient the US consumer can be to spending at an unsustainable rate
If you have questions or comments please let us know as we always appreciate all your feedback. You can get in touch with us via Twitter, Facebook, or you can Email me directly.
Tim Phillips, CEO – Phillips & Company
Hat tip to Calculated Risk for the savings graph, and Ritholitz and Arbor Research for the “cash on the sidelines” graph