False Start vs. Slow Start
Last Thursday the Republican Party unveiled their latest tax plan. I would say it’s hardly worth spending any considerable amount of time discussing in detail, as it’s not clear what’s going to withstand the onslaught of lobbyists and special interest groups jockeying for the upper hand. Whatever the final plan is, it will need to pass the Senate using what’s known as reconciliation. Through reconciliation, the Republican Party can pass this bill without any support from the Democrats, as long as they keep the deficits on this bill at or under $1.5 trillion. [i]
Here’s the initial ten-year summary of the costs and savings associated with the proposed bill:
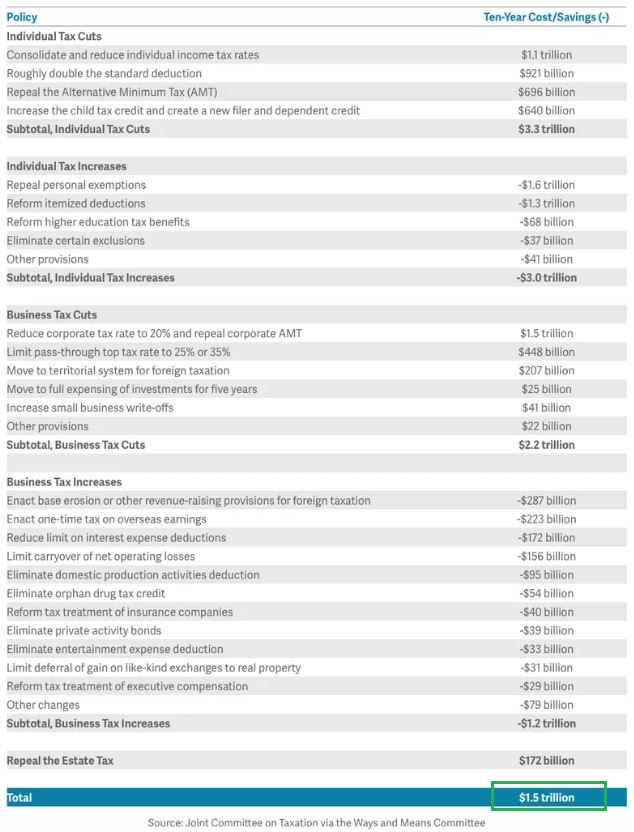
By no means am I saying that this bill, as it currently is, will be the one that passes. However, the likelihood is high that some version of the bill, one that adds an additional $1.5 trillion over ten years to the U.S. economy, will make its way through Congress and onto the president’s desk for signature.
The fact of the matter is that questions remain: Who will end up benefiting in the end? What will the plan ultimately incentivize? What items stay and what items will get cut? What’s crystal clear to me is that Congress and the president will most likely get a $1.5 trillion net stimulus tax package done, and it will happen without any Democratic support. The risks are too great for failure.
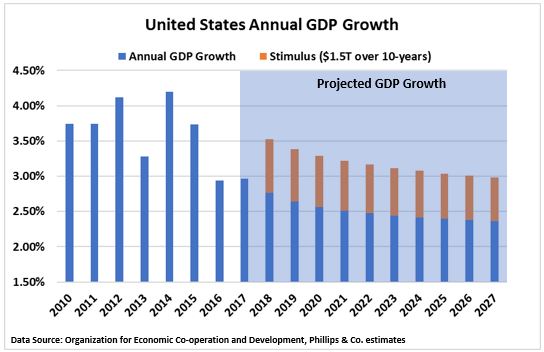
In fact, if you take the “tax stimulus package” in its current, most simplistic state, one could say that we are adding on average 0.68 percent to the GDP per year over the next ten years (that’s $150 billion per year for ten years, adjusted for projected annual GDP growth). Based on actual GDP growth from the World Bank and projected GDP growth from the Organization for Economic Co-operation and Development (OECD), here’s how this could look: [i, ii, iii]
On top of this, if U.S. companies can capitalize on any incentives to bring overseas cash back onshore, that could be an additional boost to GDP growth here as well.
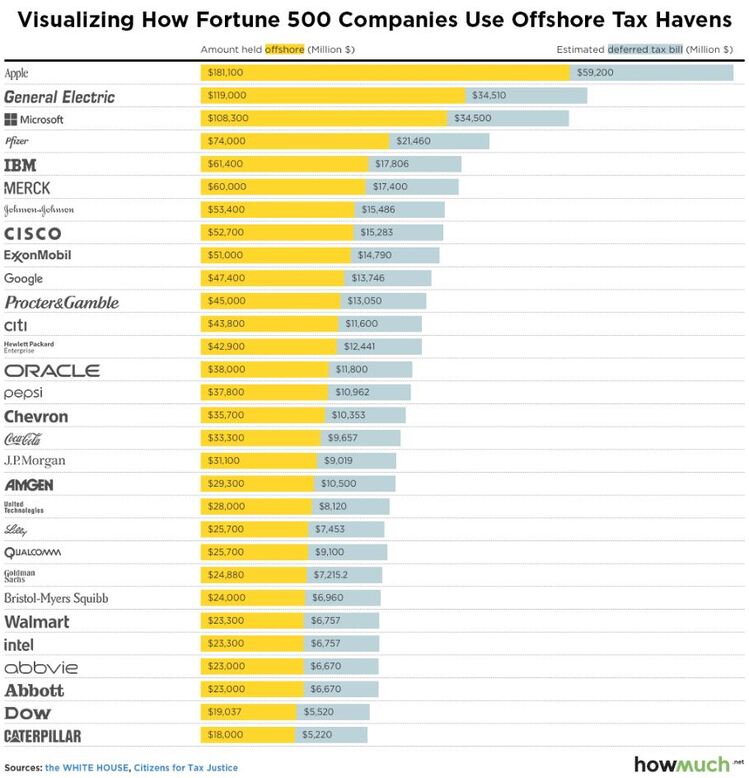
Fortune 500 companies are storing more than $2.1 trillion in accumulated profits offshore for tax purposes, with the following thirty companies accounting for 65 percent of the total. [iv]
Obviously, not all $2.1 trillion would flow back through the “real” economy. Some of this would likely be used to pay down the corporate debt that many companies have taken on in order to pay dividends to shareholders and/or increase stock repurchase programs. [v]
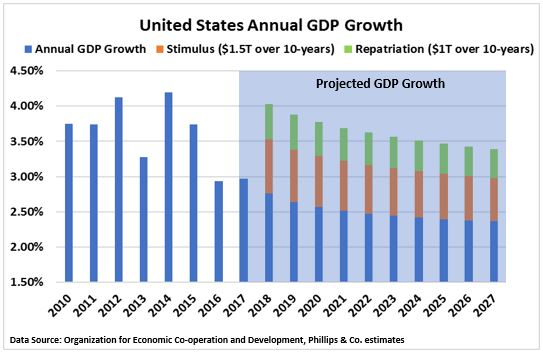
However, let’s say only 50 percent makes its way back onshore over the next ten years. To make the math easy, let’s use $1 trillion. Building on our previous chart (United States Annual GDP Growth), $1 trillion over ten years would be roughly $100 billion of additional growth each year; this could translate into an average of 0.45 percent added to annual GDP for the next ten years. Here’s how that could look based on our previous projections. [i, ii, iii, iv]
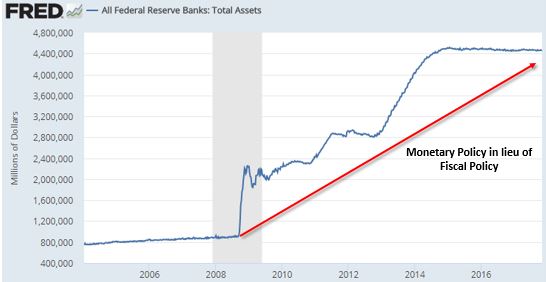
Keep in mind that the alternative to any fiscal policy changes will likely be met with more monetary policy the next time the United States has a recession. In lieu of fiscal policy, the past president relied on the Fed to stimulate the economic recovery through monetary expansion. This ballooned the Fed’s balance sheet to roughly $4.5 trillion. [vi]
One thing we know is that this massive Fed stimulated economy simply does not match up with other post-World War II economic recoveries. [vii]
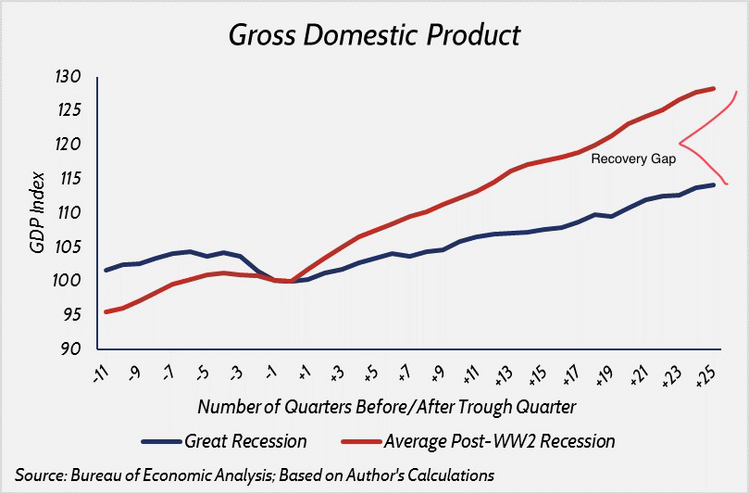
Perhaps Congress and the president can help recover lost economic time by pushing economic growth back up toward 4 percent. This could allow for an easier unwinding of the Fed’s balance sheet and further incentivize companies to reinvest in the U.S. economy.
As always, there will be winners and losers in this tax package. Let’s just hope this is not another false start for fiscal policy and the U.S. Congress. The alternative is likely going to be bleak in a world dependent on the Fed and other central banks.
If you have questions or comments, please let us know. You can contact us via Twitter and Facebook, or you can e-mail Tim directly. For additional information, please visit our website.
Tim Phillips, CEO, Phillips & Company
Robert Dinelli, Investment Analyst, Phillips & Company
References:
i. https://www.vox.com/policy-and-politics/2017/11/2/16599408/republican-tax-plan-in-one-chart
ii. https://data.worldbank.org/country/united-states
iii. https://data.oecd.org/gdp/gdp-long-term-forecast.htm#indicator-chart
iv. https://howmuch.net/articles/tax-havens
v. Bloomberg L.P.
vi. https://fred.stlouisfed.org/series/WALCL
vii. https://www.americanactionforum.org/insight/charting-the-economic-recovery/