Getting Back What’s Lost

Now that Q1 GDP has been reported with a decline of 4.8%, it is time to move on to the really bad expectations. GDP for Q2 is anticipated to come in at -37.9% making the recession official. Of course, we won’t see this data until mid-July after the quarter ends but, we all know how this movie ends: When there is a suspension of revenue forced upon U.S. businesses and an order to “stay home and stay healthy,” the end of the movie is anti-climactic. [i]
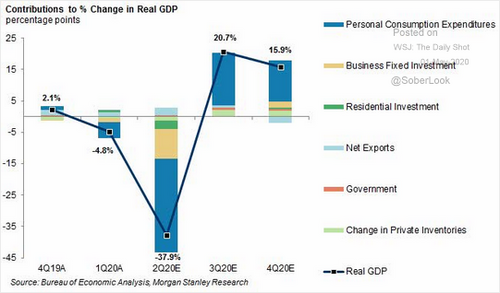
Consumption drops and craters U.S. GDP.
What do consumers do when they are not spending? They save! Just look at the linear growth in the US Savings Rate. It’s up to over 12.5% from 7% in one month. [ii]
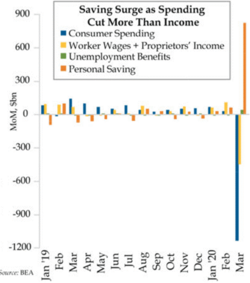
Consumer spending declined nearly $1.2 trillion—or 5.5% of U.S. GDP—in one month and consumers saved almost $900 billion dollars—or 3% of GDP—in the same month of March.
At least we know the U.S. consumerism economic model works in corollary; if you’re not spending, you’re saving. My bet is that it will work in reverse order as well.
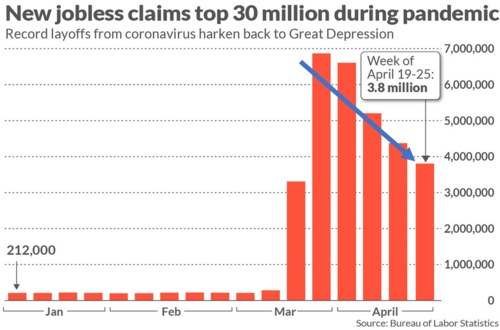
Job losses are mounting, with over 30 million and counting. At some point, the economy sheds so many jobs the losses start to dissipate. [iii]
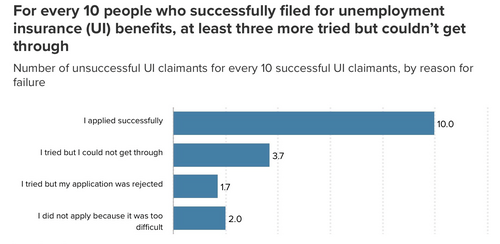
Unfortunately, the number of reported jobs lost may be significantly underreported. According to a recent survey by the Economic Policy Institute, for every ten people that successfully filed for unemployment insurance, there were another 30% that tried and failed. I suspect that 30% more jobs lost than reported will add to the recovery timeline. [iv]
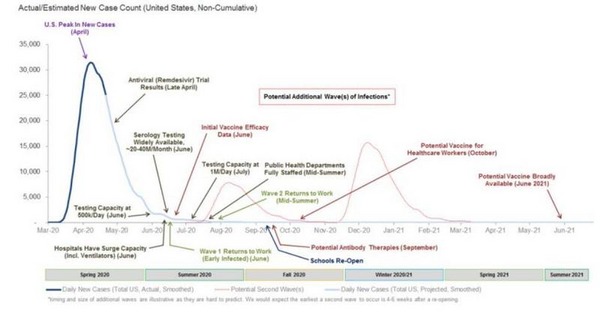
V-shaped economic recovery expectations are being pushed aside for more of a U-shaped recovery. We have been anticipating more of a “swoosh” shape or ripple pattern in the coming quarters—especially if there is a second or third wave of the coronavirus. [v]
The industries that have likely contributed to the most job losses—tourism, retail, and restaurants—represent a large part of our overall growth in GDP. Consumer spending in these industries represent 19% of GDP and 20% of payrolls. [vi]
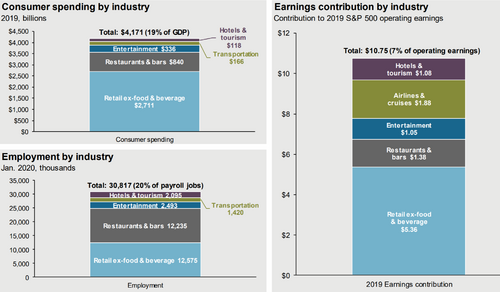
The silver lining is these industries only represent 7% percent of S&P 500 operating earnings.
Lose your job, skip a car payment!
It is no surprise that we are seeing significant increases in extensions for both prime and subprime auto loan payments. [vii]
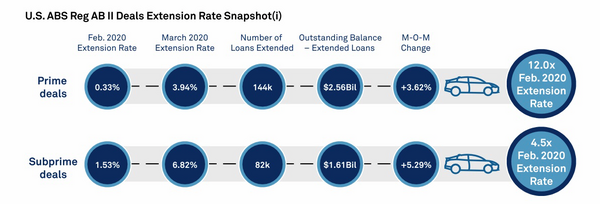
Shockingly, prime creditors extended auto loans by 12x between February and March versus those in the subprime segment at only 4.5x. Perhaps auto credit issuers are favoring those with better credit by extending terms compared to those with worse credit. This will be a trend to watch in other segments of consumer finance.
So, what does all of this mean for equity markets? Unfortunately, not much in the way of forward progress on growth for a while.
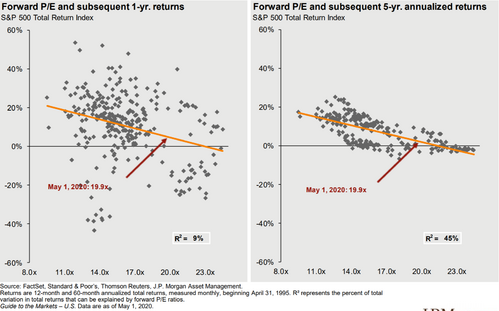
With valuations currently at 20x forward price-to-earnings for the S&P 500, there is little room for gains in both one-year and five-year expected rates of return. [vi]
Further “event-driven” bear markets, according to Goldman Sachs, suggest we may have had a pretty quick and robust rally. [viii]
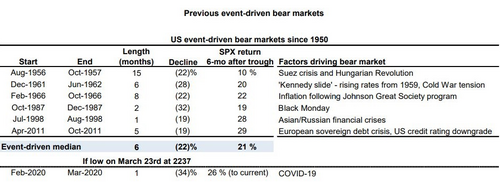
An average decline of 22% followed by a gain of 21% in just six months appears to be the norm. During the current bear market, the S&P 500 fell 34% in one month and has since gained back 26%. Perhaps we are going to need more good news to push markets higher or simply hold on to current gains.
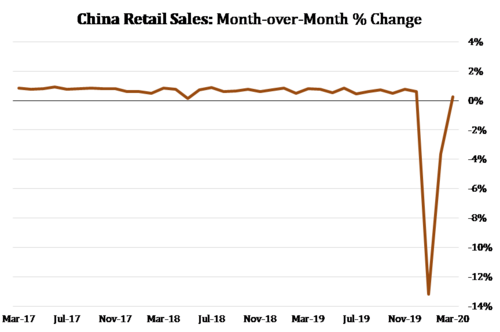
While it looks like we may have reached full value based upon current earnings estimates, China’s consumer recovery offers some hope for a return to normal. [ix]
Maybe the big Q2 GDP decline won’t be as draconian as anticipated. I spent the past week in Nashville, Tennessee and saw significant signs of a return to a “new normal.” There were people driving, lines for grocery stores that are limiting occupancy, and restaurants with patrons dining (albeit at only 50% capacity).
It is easy to fall into despair, especially as we all live in a bubble within our own community. However, I’d never want to bet against the human spirit to try and get back what they lost and look forward to what new they can gain. That spirit drives consumption, earnings, jobs, and growth.
The Great American (and Chinese) consumption cycle is on the mend.
If you have questions or comments, please let us know. You can contact us via Twitter and Facebook, or you can e-mail Tim directly. For additional information, please visit our website.
Tim Phillips, CEO, Phillips & Company
Sources:
i. https://blogs.wsj.com/dailyshot/2020/05/01/the-daily-shot-u-s-savings-rate-spikes/
ii. https://www.mauldineconomics.com/frontlinethoughts/the-figure-it-out-economy
iii. https://www.marketwatch.com/story/us-jobless-claims-climb-38-million-in-late-april-to-push-coronavirus-total-to-30-million-2020-04-30
iv. https://www.epi.org/blog/unemployment-filing-failures-new-survey-confirms-that-millions-of-jobless-were-unable-to-file-an-unemployment-insurance-claim/
v. https://www.morganstanley.com/ideas/coronavirus-peak-recovery-timeline
vi. https://am.jpmorgan.com/us/en/asset-management/gim/adv/insights/guide-to-the-markets
vii. https://www.spglobal.com/ratings/en/research/articles/200501-sf-credit-brief-while-stay-at-home-orders-clear-traffic-u-s-auto-loan-extensions-rise-11472314
viii. https://www.goldmansachs.com/careers/divisions/global-investment-research/
ix. https://www.bloomberg.com/quote/CNRSCYOY:IND