Here’s What I Know

Two weeks ago, equity markets were in free fall, with the S&P 500 index posting its worst December since the Great Depression in 1931. [i]
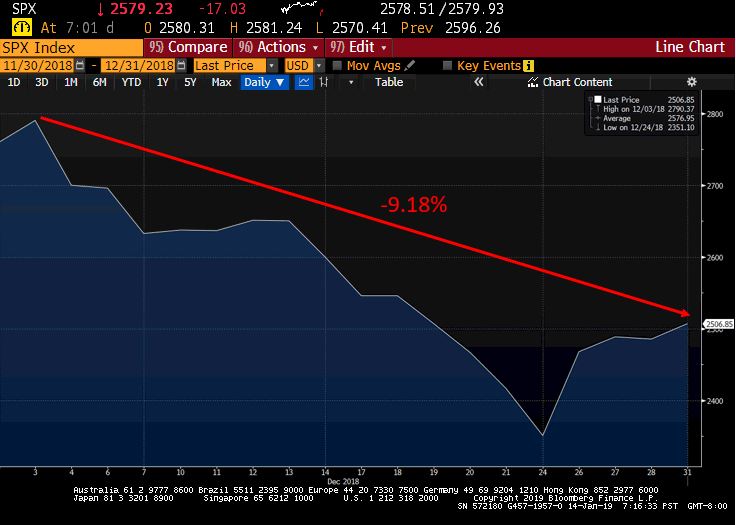
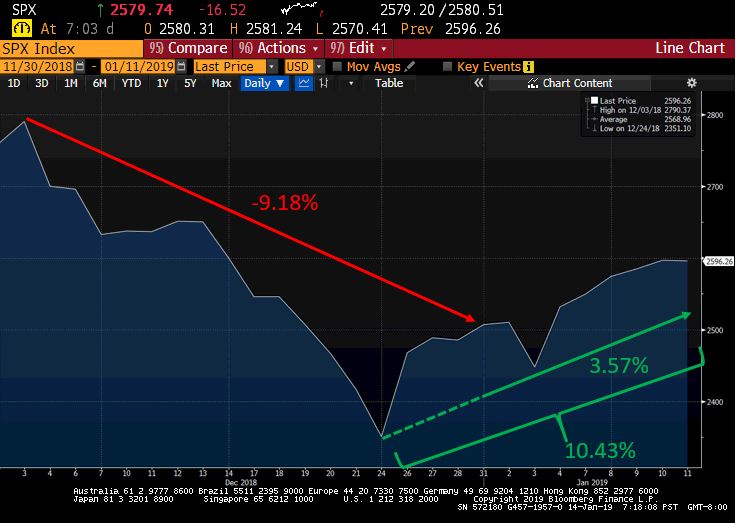
Today, just two weeks into the new year, equity markets are on the rebound. The S&P 500 has rallied 10.43 percent off the low, recovering 3.57 percent of December’s equity meltdown. [i]
When I was a young financial advisor, with limited skills in my chosen profession, I would become as emotional as my clients. If they were calm, I was calm. If they were reactive, I was reactive. Perhaps that is why, after thirty years of advising clients, I feel like I’ve developed some tradecraft.
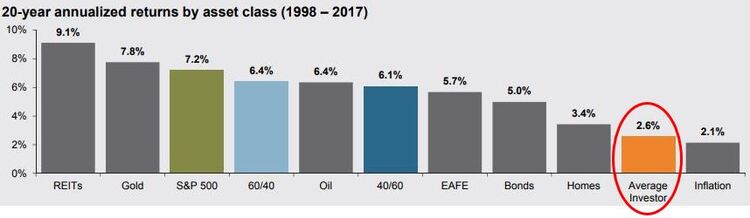
Individual investors generally post weaker returns compared to those of both the broader market asset classes and balanced asset allocation portfolios. [ii]
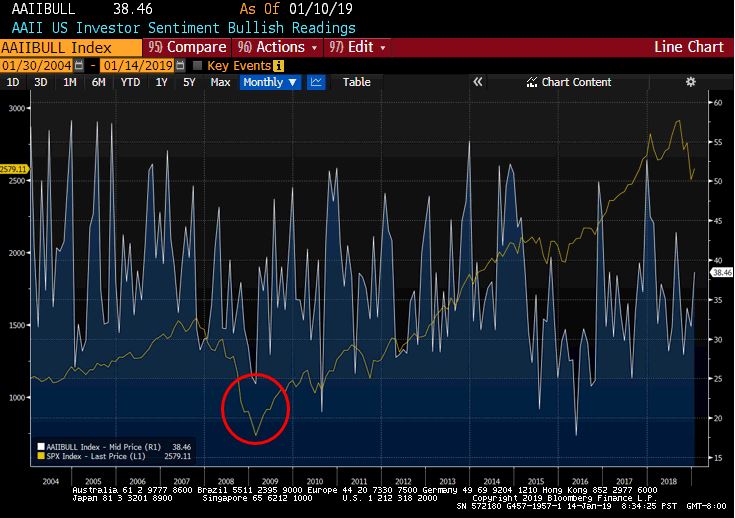
Generally speaking, those same investors tend to sell when they should buy and react when they should not. Just look at individual investor sentiment at the worst part of the financial crisis. Using the AAII Index, you can see individual investor sentiment is at its worst exactly when the market bottoms out, and then proceeds to take off on the historic bull market that we’re still in today. [i]
So here is what I know about investing in equity markets.
First, diversification is the only “free lunch in finance.”
You can see from the table below, no asset class on a year-over-year basis has consistently dominated the markets. Some years small company stocks lead; other years, it’s the large company stocks, and at other points, it might be emerging markets or real estate. [ii]
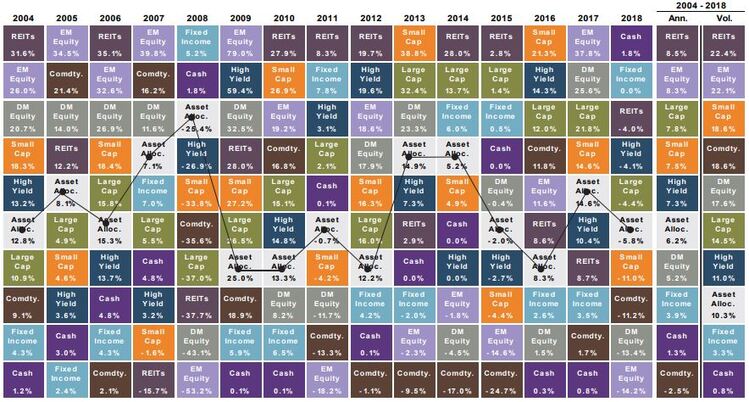
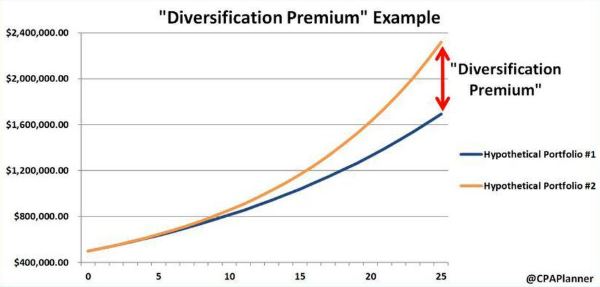
In addition, there is almost no cost attached to smart diversification; if done properly, investors can even reduce risk while maintaining their return targets, and in some cases, expand the growth potential of their portfolios. [iii]
Second, markets move in brief bursts; if you miss even a few days, you might miss all the advantages.
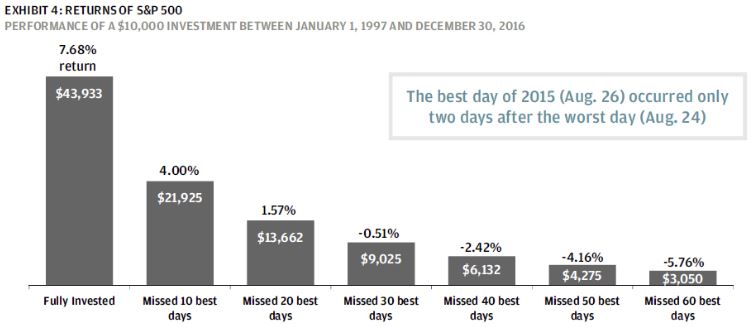
Over a ten-year period of market returns, a portfolio fully invested in the S&P 500 generates, on average, a return of just over 7.5 percent annually. But if you missed the ten best days during that ten-year period, your returns would be cut nearly in half. [iv]
So what percentage of trading days do those ten best days amount to over a ten-year period? Let me explain. There are approximately 252 trading days in a given year, so multiply that number by ten years and you have 2,520 days. And that means those ten days amount to less than half of one percent (0.40 percent) of that time total. That’s an incredibly small number. In other words, missing out on only 0.40 percent of trading days costs you more than nine times that in return potential.
Extend that same scenario to missing twenty of the best trading days over the same ten-year period, and you lose almost 90 percent of your potential investor returns. Based on the same math above, by missing out on only 0.79 percent of trading days, investors may be sacrificing almost eight times that in their return potential. [iv]
And if you miss thirty of the best trading days, your annualized return is negative. That’s clearly not a great retirement strategy. [iv]
Third, time shapes risk.
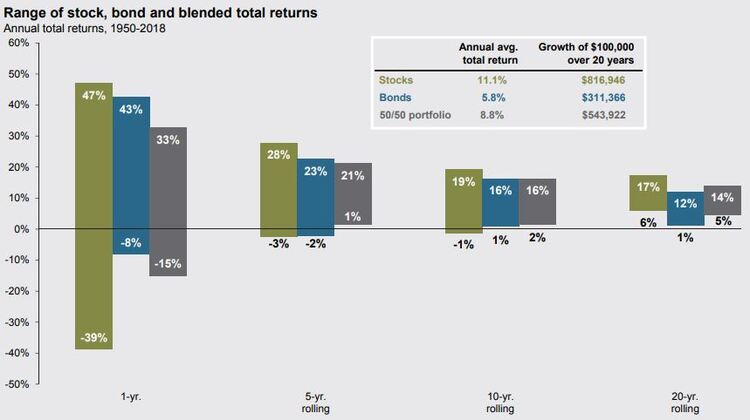
Exposing your portfolio to equity markets requires tremendous patience. In the short run, markets can be extremely volatile. I probably don’t need to tell you that because you experienced in the last few weeks of 2018. But long-term equity investing can produce some reliable and helpful return averages for investors.
If you examine the one-year range of returns for the S&P 500 since 1950, you will see a wide range of return outcomes, from a negative 39 percent to a positive 47 percent. As an investor, if you’re tempted to time the market, I refer you back to the first two charts to see what your likely outcome could be. [ii]
With that said, if your time horizon is long, you can see how the risk of negative equity returns is shaped out, providing investors with long-range risk and returns that they can depend on for retirement.
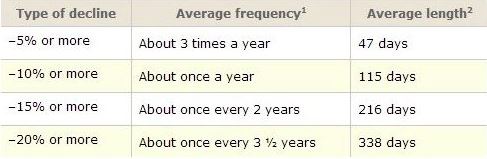
Fourth, don’t do something; just stand there.
While you wait for your returns, you are likely to experience some difficult times. That is apparent when you consider the frequency and longevity of corrections and bear markets. [v]
In my experience, investors often can become downright desperate while they wait. But most of the time, your best bet, beyond rebalancing and dollar-cost averaging, is to remain patient.
Fifth, and last, your behavior will likely dictate your outcome.
Fear is not a risk measurement, just like hope is not an investment strategy. That is what I have learned over thirty years in this business and I have a feeling we are going to test many of those lessons in 2019.
If you have questions or comments, please let us know. You can contact us via Twitter and Facebook, or you can e-mail Tim directly. For additional information, please visit our website.
Tim Phillips, CEO, Phillips & Company
Robert Dinelli, Investment Analyst, Phillips & Company
References:
i. Bloomberg, L.P.
ii. https://am.jpmorgan.com/blob-gim/1383407651970/83456/MI-GTM_1Q19_Linked.pdf?segment=AMERICAS_US_ADV&locale=en_US
iii. https://www.forbes.com/sites/jeffreylevine/2018/07/31/the-big-benefit-of-diversification-no-one-talks-about/#49b4155e43cf
iv. https://am.jpmorgan.com/us/en/asset-management/gim/adv/insights/navigating-volatility
v. https://phillipsandco.com/files/9615/4664/3284/Look_Ahead_2019Q1_Final.pdf