Horriblization
While “horriblization” is not a real word, it seems like it should be lately. Although there is no actual definition in the dictionary, I think I can loosely define it as taking something that is not that bad, and exaggerating it as way worse.
It seems like investors are letting their emotions make their investing decisions lately with the increased volatility in the equity markets. Generally, the act of “horribilizing” (another made up word) is generated from a lack of information which leads people to "make stuff up". We can relate “horribilizing” to a well know behavioral bias called "peak-end" bias. That's when you take your last peak experience and stretch it out to a current circumstance (end). In our case, it would be taking the pain and uncertainty during the financial crisis (peak) and assuming we are in store for another severe recession now (end).
I'm going to take the next couple of weeks to see if I can shed some data-driven light on the mix of horrible messages circulating in the market place of ideas.
Topics I hear often are: Oil, China, Strong Dollar, Global Slowdown, Interest Rate Hikes and Earnings.
There is no denying that oil is a major contributor to the S&P 500. The energy sector represents 6.5% of the S&P 500 index. When oil company earnings take a hit, the effect ripples through the entire market. [i] 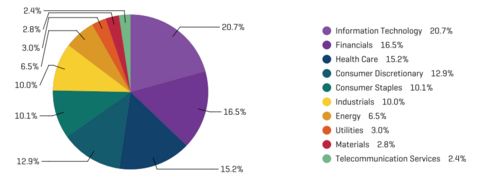
Today, with oil prices down 70% from their 2014 peak, the sector is a -5.4% drag on S&P 500 earnings. [ii]
That's the bad news. Here's the good news. Like anything, this too shall pass and there will be an equilibrium price where supply meets demand. See the chart below. It looks like we might find that sometime in 2016 as supply continues to trend down (Including Iranian oil production hitting the market) which should lead to a recovery and some stability in oil prices. [iii]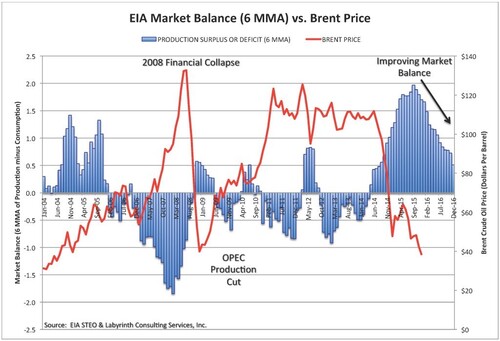
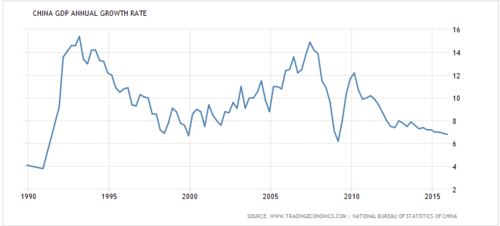
China is the next item on the horriblization list. It's true China’s GDP growth has been dropping from its peak several years ago to just below 7% today. As we have written in numerous posts (you can read them here, here and here), China’s economic shift is by design and we must remind ourselves that change can be a bit rough at times. [iv]
Interestingly China, even at these lower levels of growth, represents a significant part of Global GDP Growth. While the U.S. is about an $18 trillion economy and grows at 2% per year or $360 billion, the Chinese economy is at $10 trillion growing at 7% pace or $700 billion per year, which is double the U.S.
In fact, the Chinese economy makes up almost 40% of Global GDP growth; that's nearly double what it was in 2005 when it was growing at 11%. [v]
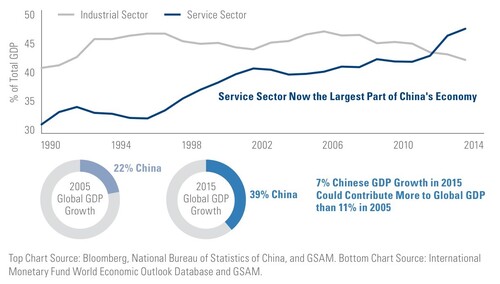
So how far can China’s growth shrink? Probably more in the near term. However, it's the quality of the growth they are now achieving that is the cause for optimism. From the chart below you can see an economy that is going through a period of structural change that will ultimately help secure long-term sustainable growth. [vi]
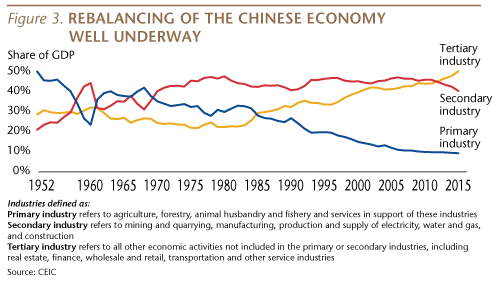
China’s economy now generates 59% of GDP from service sector industries such as real estate, retail, finance, etc. Infrastructure capital expenditures (water, electricity, transportation, ect.) are down from around 56% of GDP just 3 years ago to 39% today. China’s economy is becoming more advanced.
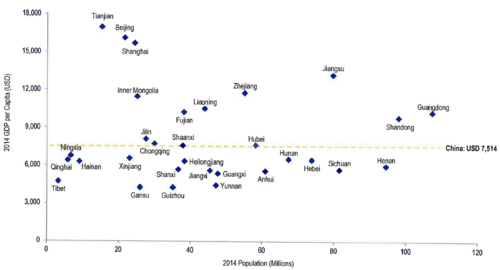
Further, what continues to drive Chinese policy makers is the need to provide stability to their large population. After all, 90 million Registered Communist Party Members can't control a population of over 1.1 billion people without providing some benefits. There are plenty of cities in China that need to improve the long-term economic prospects for their citizens. China’s economic growth has not been even across the country. This may be the opportunity for China’s leadership to transform their emerging market economy to that of a developed market. [vii]
So how do we profit from this turmoil? Perhaps a move back to MLP's in the energy space but likely on the active management side versus passive. Hold emerging markets with a tilt toward China as valuations continue to present themselves. In fact, looking at both sectors relative to their historic valuations shows the opportunity we have today.
The Energy Sector is below its 10-year average valuation. [viii]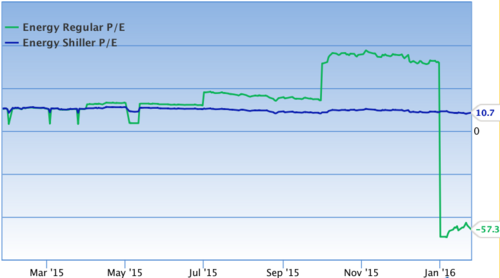
China’s valuation is lower than its 10-year average. [ix]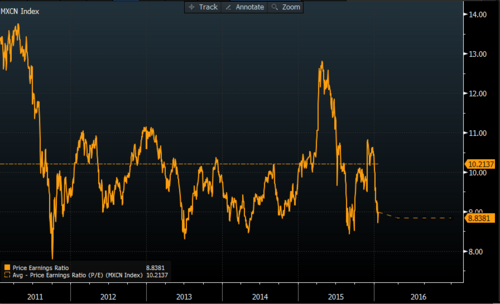
The recent market volatility adds to the opportunity to invest in areas of the market that are “on sale” as long as we don't fall prey to the emotions of horribilizing. The data should drive the decisions.
If you have questions or comments, please let us know as we always appreciate your feedback. You can get in touch with us via Twitter, Facebook, or you can email me directly. For additional information on this, please visit our website.
Tim Phillips, CEO – Phillips & Company
Chris Porter, Senior Investment Analyst – Phillips & Company
References:
[i] http://us.spindices.com/indices/equity/sp-500
[ii] http://www.factset.com/websitefiles/PDFs/earningsinsight/earningsinsight_1.22.16
[iv] http://www.tradingeconomics.com/china/gdp-growth-annual
[vi] http://seekingalpha.com/article/3831056-matthews-asia-surviving-chinas-volatility
[vii] Neuberger Berman
[viii] http://www.gurufocus.com/stock-market-valuations.php
[ix] Bloomberg, LP