Housing Health

Despite all of the political news saturating the media day in and day out, discussion of the housing market has certainly found its voice. If you follow the news, headlines suggest housing is on a slowing trend.
“Housing market is showing signs of cracking: 'Anything-goes list-price strategy is no longer working'” – CNBC [i]
“The U.S. Housing Market Looks Headed for Its Worst Slowdown in Years” – Bloomberg [ii]
“U.S. new home sales at eight-month low, housing slowing” – Thomson Reuters [iii]
“America's housing market is raising a 'large red flag' for the economy” – Business Insider [iv]
“Housing correction; Our cities house-price index suggests the property market is slowing” – The Economist [v]
This is certainly true if you look at only 2018. However, when you compare 2018 with 2017, you get an entirely different picture. [vi]
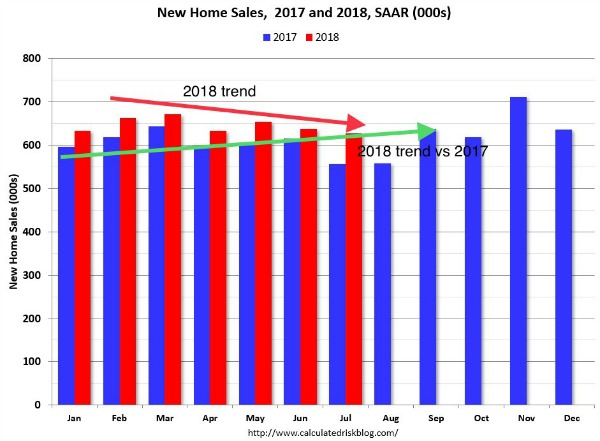
As you can see, new home sales data looks much stronger in 2018 than 2017. [vi] In fact, 2018 looks to be one of the strongest years since before the great financial crisis. [vii]
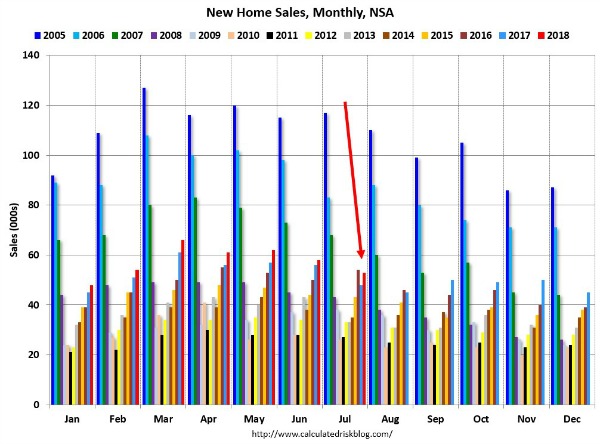
If you exclude 2005 – 2007 data from the above chart – based on the fact that these years look almost unrepeatable – 2018 looks to be one of the strongest housing markets we’ve seen in many years. [vii]
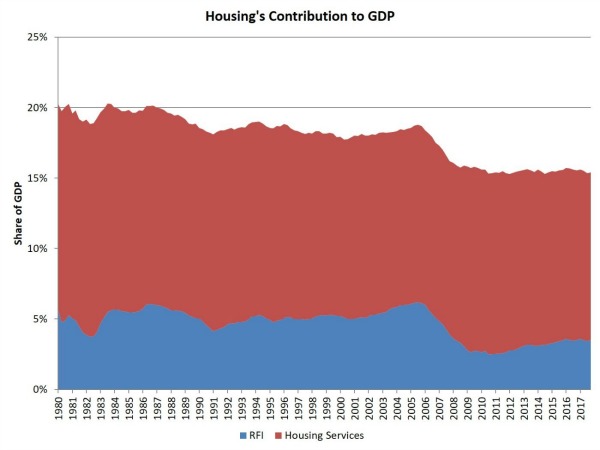
This strong housing data would explain some of the reason we’re experiencing strong GDP growth as well. As many would speculate, housing is a significant part of our almost $20 trillion economy. To put this into context, housing represents over 15 percent of the total U.S. GDP; where housing in terms of GDP is represented by residential fixed investments and housing services. [viii]
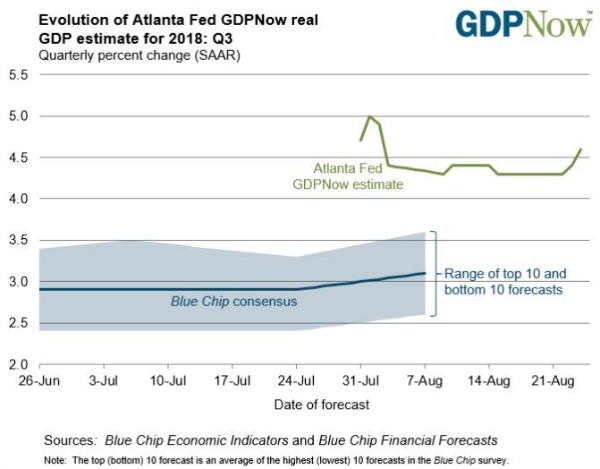
Furthermore, the strength in housing can be seen in forecasts for Q3 GDP growth, which according to the Federal Reserve Bank of Atlanta, is tracking above 4.5 percent. [ix]
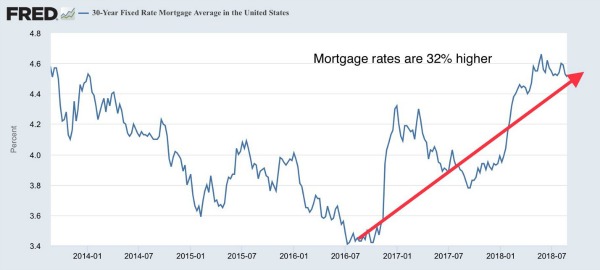
Remarkably, all of the strength in housing is coming at a time when mortgage rates have increased 32 percent since the most recent bottom in 2016, which also coincided with a retesting of the historical lows seen in 2013. [x]
Understanding what’s going on in the housing market can be valuable to many. Understanding what’s going on in the housing market within the context of the equity market is even more valuable to investors, especially those who are investing in equities.
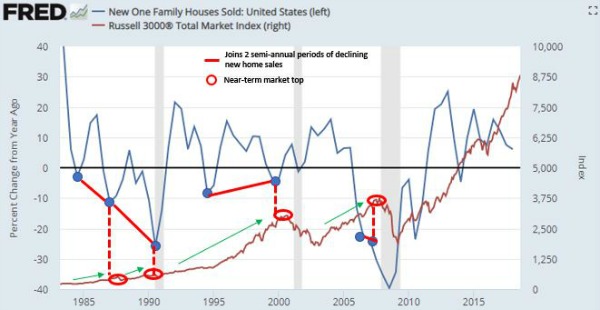
The above chart compares year-over-year changes in new home sales and the Russell 3000 Index, which comprises over 97 percent of the total stock market. In almost every instance, following a bull market, two consecutive semi-annual periods of declining new home sales have coincided with a near-term top in the equity markets nine to twelve months later. [xi] [xii]
As with most things, the financial news media is blowing this way out of proportion. The reality is, the health of the housing market remains strong, despite a slowing trend within 2018 and rising interest rates. However, the trend is not something to be ignored. Periods of declining new homes sales have been a fairly reliable leading indicator for what lays ahead in the equity markets. Housing is certainly a trend that is correlated to equity prices, and we need to watch this trend closely.
If you have questions or comments, please let us know. You can contact us via Twitter and Facebook, or you can e-mail Tim directly. For additional information, please visit our website.
Tim Phillips, CEO, Phillips & Company
Robert Dinelli, Investment Analyst, Phillips & Company
References:
iv. https://www.businessinsider.com/us-housing-slowdown-economy-2018-7
vi. https://www.calculatedriskblog.com/2018/08/comments-on-july-housing-starts.html
vii. https://www.calculatedriskblog.com/2018/08/a-few-comments-on-july-existing-home.html
viii. http://eyeonhousing.org/2018/04/housing-share-of-gdp/
ix. https://www.frbatlanta.org/cqer/research/gdpnow.aspx
x. https://fred.stlouisfed.org/series/MORTGAGE30US