Inflection and Diversification (A Case for International Investing)
We seem to be at another inflection point in the US economy and perhaps US equities. The US stock market has rallied for the last 72 months since the financial crisis and is up over 187%.[i]
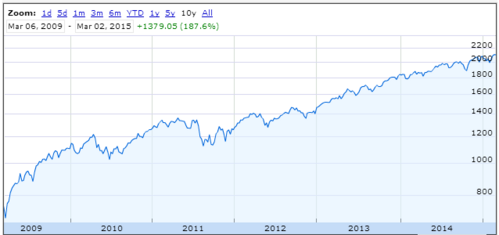
Valuations are moving to the upper end of their range compared to where they were in March of 2009.[ii,iii]

While most investors get aggressive during this time in an investment cycle, it's incumbent on us fiduciaries to step back reexamine the bigger picture.
Last week we saw one of the biggest drops in the Chicago PMI in its history and the largest since October 2008.[iv] It dropped from an expansionary reading of 59.40 to a contractionary reading of 45.80.[v] Note that the Purchasing Managers Index (PMI) measures the health of the manufacturing sector of our economy.
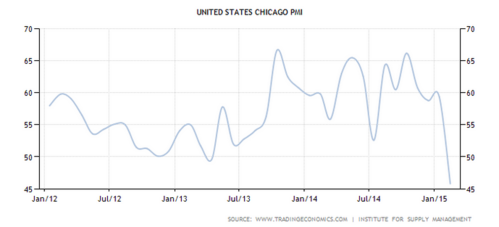
It's no small thing as manufacturing represents 12% of US GDP and supports 17.6 million jobs in the United States according to the National Association of Manufacturers.[vi] Certainly some of this can be explained by bad weather or port closures on the West Coast. However, that would be a matter of blind faith.
One large factor is certainly the strength of the US Dollar relative to almost every other currency.[vii]
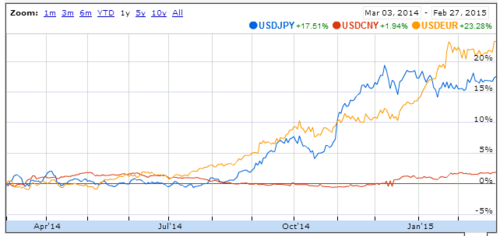
Just remember a strong dollar means our goods and services are more expensive versus imports. You can see this in the latest trade data with a continued widening of the trade gap between our exports and imports creating a significant drag on continued US GDP growth.[viii]
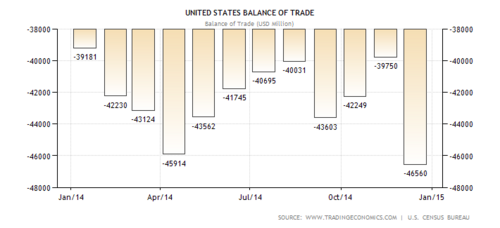
We got confirmation of this on Friday with US GDP in Q4 that showed net exports (exports minus imports) reduced growth by 1.15 percentage points in Q4.[ix]
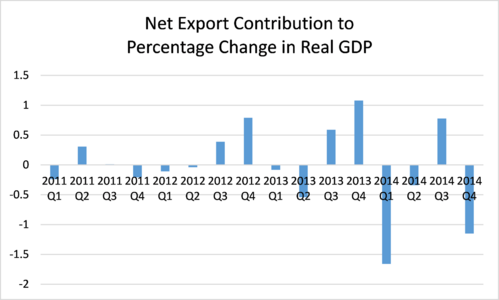
We can continue to expect this trend to persist as long as the dollar remains strong relative to other major currencies.
It's certainly never a good time to abandon sound investing principals like:
- Clearly understand your time frames for your assets and use of funds.
- Know exactly what rate of return your plan requires.
- Build sound allocations at the lowest possible risk to meet the return target.
- Rebalance and minimize taxes.
However when it comes to investing, it's also never a good time to base anything on blind faith.
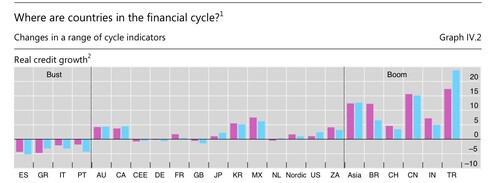
Were cautiously optimistic about 2015 for US equity investing, while allocating to international markets to perhaps take advantage of a recovery in these economies and companies, especially when you consider the expanding credit growth and strong dollar in some of these countries.[x]
I predict the coming months will test all of our nerves, and resolve to stick to sound principals versus being shaken by normal market discounting with a shift in growth rates and constituents.
If you have questions or comments, please let us know as we always appreciate your feedback. You can get in touch with us via Twitter, Facebook, or you can email me directly. For additional information on this, please visit our website.
Tim Phillips, CEO – Phillips & Company
Jeff Paul, Senior Investment Analyst – Phillips & Company
References
[i] Google Finance. (Mar 2, 2015). S&P 500 Chart.
[ii] Melin, M. (Feb. 22, 2015). S&P 500 Forward PE Ratio at Highest Level Since 2004. ValueWalk.
[iii] Multpl.com. (Mar 2, 2015). S&P 500 PE Ratio by Month and Shiller PE Ratio by Month.
[iv] TradingEconomics.com. (Mar 2, 2015). United States Chicago PMI (1967-2015).
[v] TradingEconomics.com (Mar 2, 2015). United States Chicago PMI (2012-2015).
[vi] National Association of Manufacturers. Facts About Manufacturing. Data from Bureau of Economic Analysis (2014) and Bureau of Labor Statistics (2014,2014).
[vii] Google Finance. (Mar 2, 2015). Chart of US Dollar vs Yen, Yuan, and Euro for last 12 months.
[viii] TradingEconomics.com (Mar 2, 2015). United States Balance of Trade. 2014-2015.
[ix] Bureau of Economic Analysis (Feb 27, 2015). Gross Domestic Product: Fourth Quarter and Annual 2014 (Second Estimate).
[x] Bank for International Securities. (Jun 29, 2014). 84th Annual Report. p 70.