It Only Takes One Clown to Make a Circus
We have now entered the final quarter of the year and Alcoa kicked off the final earnings season after the bell on October 11th. As we hit the home stretch we wanted to look back and compare the S&P 500 forecast from the beginning of the year, to current S&P 500 forecasts. Back in January, the average forecast for the S&P 500 2011 year end was 1384. As of October 17th the average forecast is approximately 100 points lower at 1282. What happened?
To understand what happened, first we need to understand how they come up with year-end forecasts for the S&P 500. It’s basically two things: forecasted Earnings Per Share (EPS) and a forecasted multiple. The EPS is based on the aggregated forecasted EPS from all the companies that make up the S&P 500 index. The forecasted multiple is based on the estimated level of certainty and predictability of those earnings. When there appears to be more certainty, multiples go up and when there appears to be less, multiples go down.
Earnings have been fairly good for the year and this earnings season appears to be shaping up similarly to the last two quarters; possibly a little better. The percentage of companies that have beaten earnings estimates so far is higher than the last two quarters (this is based on the companies that have reported as of October 21st).

Taking a look at the first variable EPS, the average 2011 EPS forecast for the S&P 500 was $92.75 at the beginning of the year. As of October 17th the average 2011 EPS forecast for the S&P 500 is actually up $3.60 to $96.35. This underscores the fact that companies are continuing to meet and beat earnings estimates throughout the year. Clearly, this part of the formula is not bringing down the forecasts for the S&P 500.
The other variable in the S&P 500 year-end forecast is the multiple. The mean year-end forecast at the beginning of the year implied a year-end S&P 500 multiple of 14.9. The most recent year-end forecast now implies a year-end S&P 500 multiple of 13.3.

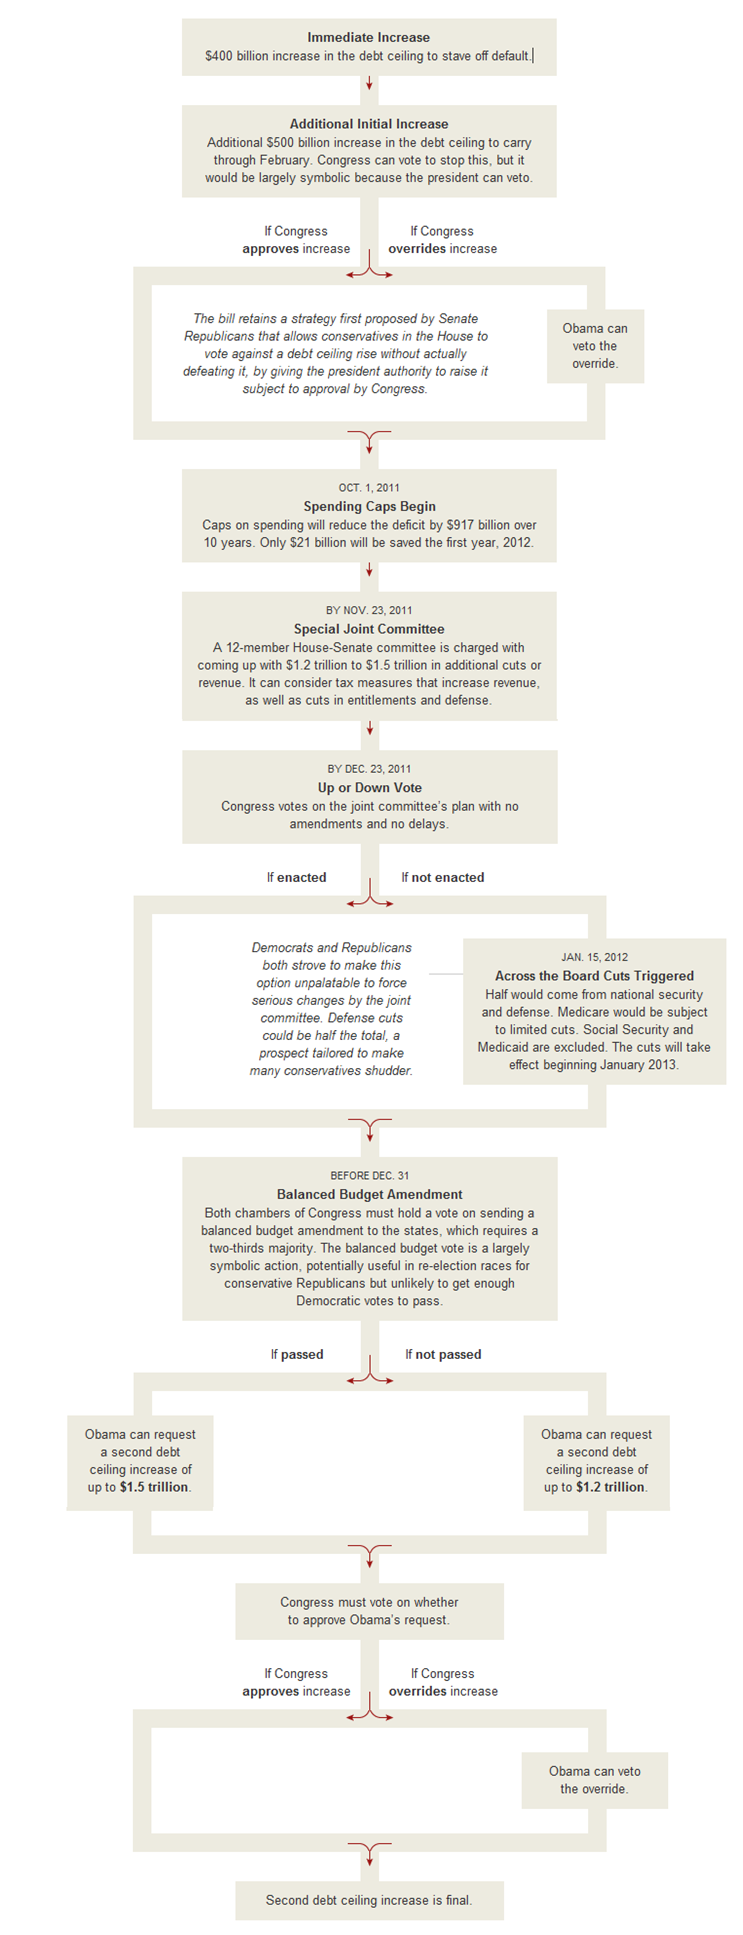
This contraction in the multiple is highly likely due to the increase in global uncertainty. In the United States, you still have the fiscal uncertainty and political silliness surrounding the “Super Committee.” The Committee’s deadline is November 23rd to come up with a proposal and congress is supposed to vote on the Committee’s budget proposal on December 23rd. In Europe, you have a grocery list of monetary and fiscal issues that are creating uncertainty in the Eurozone and the future of the Euro. German Chancellor Angela Merkel and French President Nicolas Sarkozy are supposed to make a big announcement on Wednesday regarding “a broad agreement” regarding these uncertainties. Lastly, in China you have talks about slowing GDP growth, and a real estate market bubble that could lead to a “hard landing.”
The bottom line is corporations are driving good earnings with a back drop of global political uncertainty. It used to be you could count on the corporations and the CEOs to do something that would create a circus. For example, Koslowsky at Tyco buying $6,000 shower curtains paid for by shareholders. Now it seems like the politicians are the clowns under the tent.
This circus show might be hard to watch right now, but my guess is corporate earnings and opportunities through innovation will win out over rhetorical fights, political gridlock and self-interest. In my opinion, the best way to take advantage of this current environment is to continue to invest prudently, be patient, and align investments with time horizons.
To leave you on a hypothetical high note; if we were to take todays projected S&P year-end EPS ($96.35) and multiply it by the first quarter’s year-end multiple (14.9). You would get a year-end target of 1435 for the S&P 500 and a 14.5% rally between today and the end of the year.
If you have additional feedback we encourage you to get in touch with us via Twitter, Facebook, or Email me directly.