It's No Surprise
It should come as little surprise to those that read our posts that we have had a full correction in U.S. Equities (defined as a 10% drop). After all, it's been over 1,420 days since we have had a correction of this magnitude. In fact, when you look at the frequency of corrections this length of time is an anomaly. [I]

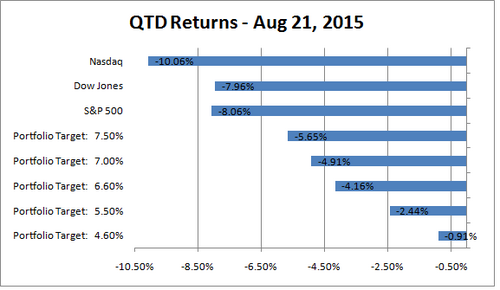
The Dow Jones, the NASDAQ, and the S&P 500 markets are in a technical correction territory (down 10%).
As with each market correction, mainstream media has its own version of events. This time the media wants to direct your attention to five major themes as reason for the correction:
1) A slowing Chinese economy and bear in their stock market.
2) Collapsing energy prices with WTI Crude Oil down 58.1% year-over-year. [II]
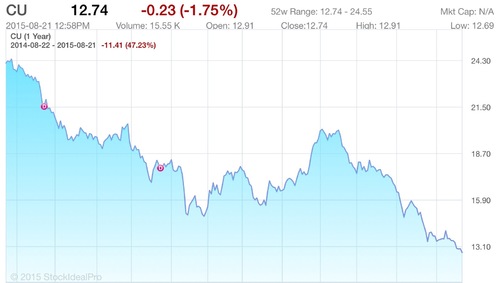
3) Commodity prices collapsing across the globe. Using copper, as an industrial metal proxy, is down -47% year-over-year.

4) A strengthening US Dollar.
5) A fast approaching interest rate hike.
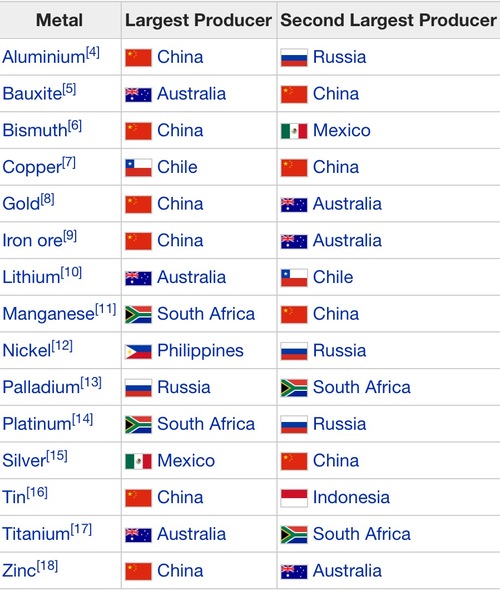
The nexus of these events certainly suggest what the media is correct about, a slowing global economy. Large commodity consumers and producers are facing slowing growth. As the second largest global economy, ($9 Trillion vs. our $18 Trillion) China is obviously a large part of the drag. When you add the GDP of China, Russia, Australia and South Africa you get a whopping 18% of global GDP. [III]

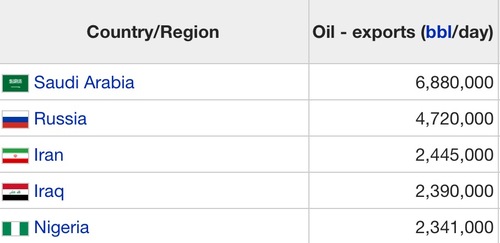
Fortunately, the largest oil exporting countries don't impact global GDP that much. In fact, their total GDP is only 5% of Global GDP. [IV]

What the media doesn't say is the simple fact that the world is slowing and you can expect central banks to take decisive, quick action to stimulate domestic growth similar to what China is doing now. But a global slowdown can't severely impact an improving U.S. Economy.
In my opinion, the correction in U.S. Equity markets is likely a reflection of a momentary pause in earnings per share growth (EPS). [V]
You can see EPS is negative, shrinking -2.70% compared to a long term growth average of 8.14%. [VI]
From my view, the correction is probably one quarter overdue and likely won't last too long. You can see from the chart below depicting rising disposable personal income, the U.S. Consumer is strong and getting stronger. The only question is if a correction will impact their spending habits.
Further, as we move into Q4 2015 and Q1 2016 year over year corporate growth rates become much easier to beat. [VII]
While the media might miss the mark, earnings still matter and until we get closer to a return to normal EPS growth rates, we can expect some more volatility. This is gut check time for U.S. Investors.
Action note:
We continue to overweight US equities, focusing on growth, and try to minimize China yet keep some exposure to the second largest economy in the world.
For our diversified clients, you can see having a blend of assets helps provide some downside protection. [VIII]

*Investor Advantage portfolios are numerically named based on 10 year targeted return rate
If you have questions or comments, please let us know as we always appreciate your feedback. You can get in touch with us via Twitter, Facebook, or you can email me directly. For additional information on this, please visit our website.
Tim Phillips, CEO – Phillips & Company
References:
[I] Bespoke data, days without 10% correction
[II] Nasdaq
[III] https://en.m.wikipedia.org/wiki/List_of_countries_by_mineral_production
[IV] https://en.wikipedia.org/wiki/List_of_countries_by_oil_exports
[V] Bloomberg terminal, current qtr
[VI] www.multpl.com/s-p-500-earnings/table
[VII] Bloomberg terminal, SPX historical trends
[VIII] Morningstar Direct Performance