Low Volatility, New Market Highs - Don’t Get Too Complacent
It seems that no matter what is going on in the world, the stock market has had little reaction and continues to reach new highs. The Federal Reserve recently expressed its concern that investor complacency could “sow the seeds for disruptive market moves that could undermine the economy.”[i] Low volatility may encourage investors to increase borrowing and to take greater investment risk, strategies that could end up being detrimental if the economy does not perform as expected.
This quiet market makes us a little skittish too, as past periods of low volatility have been followed by high volatility episodes.
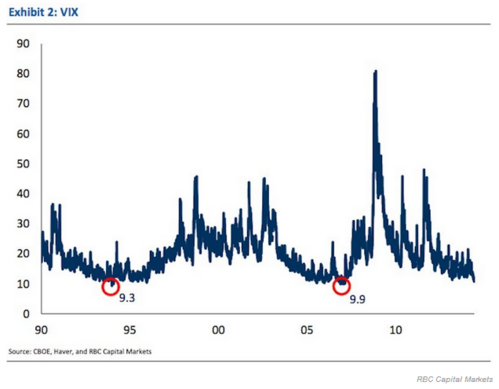
A 25-year chart of the VIX volatility index shows that we are near longer-term lows.[ii] In two previous instances, volatility increased within a few years.
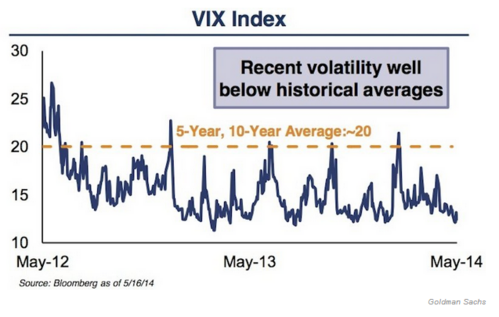
Looking at a shorter time period, we can also observe spikes in volatility every couple of months.[iii]
We can’t predict what will happen or when, however markets are more predictable given enough time. Using historical data, we can determine the average daily return and standard deviation (SD) for the market, which can help us to understand the risk. SD is a measure of how much something moves up or down from its average.
The chart and table below from the CFA Institute show the number of S&P 500 Sigma (standard deviation) Events over a 62-year period.[iv] 95% of the time, the S&P 500’s daily return was within 1 SD, which is about a range of -1.0% to 1.0%.
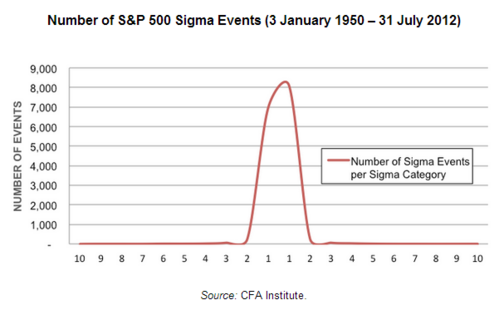
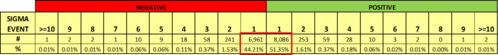
About 4% of the time, the index had a more moderate change (2 SDs to 3 SDs), and then the last 1% represents the more significant market moves. Let’s look at a few examples:
- -20.98 SD event: The Black Monday crash (October 19, 1987 ).[v]
- -7 SD event: Data shows the US economy slowing, and political and economic uncertainty in Russia (Aug 31, 1998).[vi, vii]
- -4 SD event: The US losing its AAA credit rating (Aug 8, 2011).[vi, viii]
- +4 SD event: The US Treasury announced plans to purchase toxic assets (Mar 23, 2009).[vi, ix]
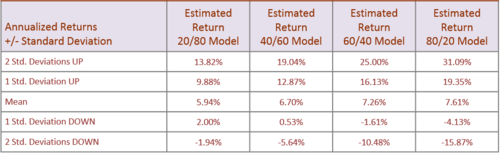
The preceding data and examples apply to the S&P 500, a 100% equity index. A balanced portfolio would have lower SD due to the inclusion of less correlated assets, such as fixed income. Looking at annual returns and SD provides a way to measure your threshold for market declines.
The table below shows the estimated range of returns for different allocation portfolios based on their respective 10-year mean annual return and standard deviation.[x] Higher equity allocation (e.g. 80/20) results in larger return ranges. The table only represents 2 SDs, so keep in mind that about 5% of the time, annual returns exceed these ranges.
Your target return drives the level of risk you take, so unfortunately, risk cannot be avoided. However, if the potential decline makes you lose sleep at night, there are some proactive steps you can take to manage it.
- Consider spending less of your income and build a reserve fund to help you wait out any periods of volatility.
- Re-evaluate your target return rate and investment allocations. Make sure you aren’t taking more risk than necessary to achieve your goals.
- With the market run-up, your portfolio likely has a higher weighting of equities than it did at the start of the year. This may be a good time to review your portfolio allocations and rebalance while the markets are at their high and in this low-volatility mode.
If you have questions or comments, please let us know as we always appreciate your feedback. You can get in touch with us via Twitter, Facebook, or you can email me directly. For additional information on this, please visit our website.
Jeff Paul, Senior Investment Analyst – Phillips & Company
Tim Phillips, CEO – Phillips & Company (Editor)
References
[i] Reuters. (May 30, 2014). Low volatility sparks concern at Fed over investor complacency.
[ii] Udland, M. (Jun 16, 2014). Wall Street’s Summer of Doom: Why Everyone is Board and Bleeding Money. Business Insider.
[iii] Ibid.
[iv] Voss, J. (Aug 27, 2012). Fact File: S&P 500 Sigma Events. CFA Institute.
[v] Ibid.
[vi] Yahoo Finance. S&P 500 Daily Historical Adjusted Closing Prices.
[vii] CNNMoney. (Aug 31, 1998). Historic losses wipe out market’s gains for 1998 as global turmoil mounts.
[viii] Sweet, K. (Aug 8, 2011). Dow plunges after S&P downgrade. CNNMoney.
[ix] Zacks. (Mar 23, 2009). Stock Market News for March 23, 2009.
[x] Morningstar Direct. 10-year statistics for a portfolio consisting of the S&P 500 and Barclays Aggregate Bond Indices in the specified proportions.