No Eggs!

As I write this post, I am having breakfast at a hotel in California. I ordered eggs and was told they have no eggs and that it is very spotty when they come in. Are chickens not laying eggs due to COVID? I don’t think so. [i]
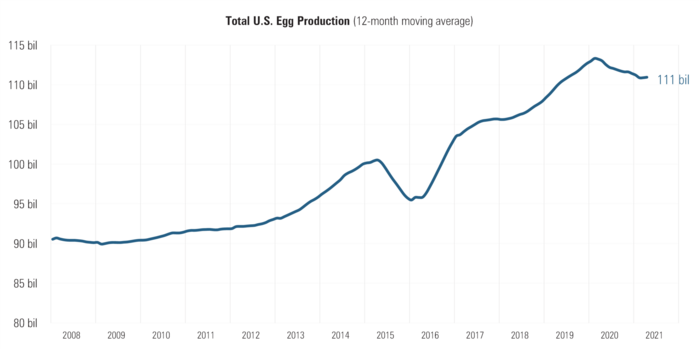
Egg pickers, truck drivers, packaging plant workers, warehouse workers, safety inspectors, merchants, wholesalers, and presumably others are all needed for me to have eggs for breakfast.
While the egg supply chain does not make the headlines, you do hear a lot about inflation, rising wages, and supply chain disruptions, including in childcare. For the U.S. economy to return to pre-pandemic expansion, these forces need to find equilibrium soon. Prolonged economic fits and starts will create more volatility in equity markets and consumption patterns.
All of these byproducts of an uneven recovery from COVID-19 are generally centered around the ability to hire workers to get goods and services up and running, including for eggs.
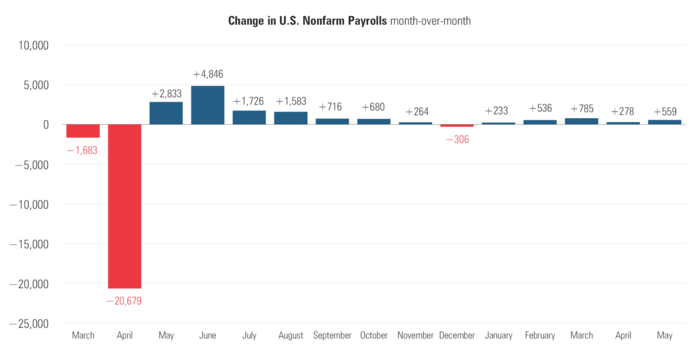
Some really good news in the recent jobs report reflects a rapidly recovering American worker.
The U.S. economy added 559,000 jobs in May, markedly better than April’s jobs report which showed just 278,000 jobs added. [ii]
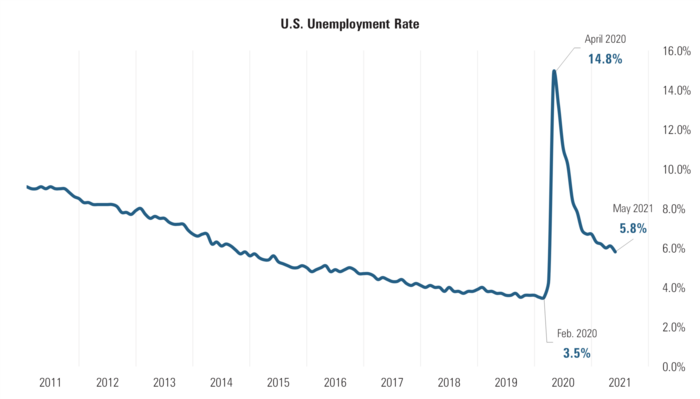
The unemployment rate dropped to 5.8% from 6.1% in April. [ii]
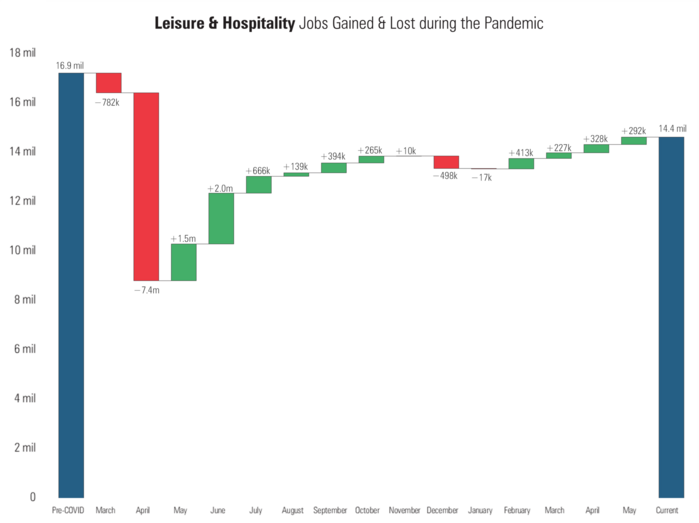
The sectors that added the most jobs were in some of the hardest hit areas of the economy, namely Leisure & Hospitality, Education, and Health Care. [ii]
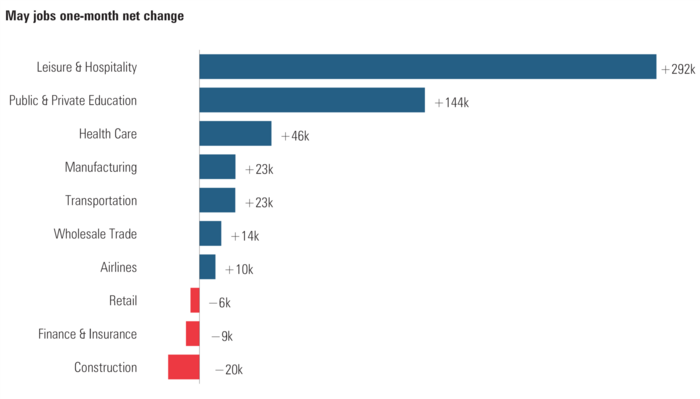
As noted above, the Leisure & Hospitality sector is making a quick comeback compared to pre-COVID levels. [ii]
Another way to look at unemployment data is in the JOLTS numbers, which help measure job vacancies and hires. The JOLTS data serves as a demand-side indicator of labor shortages at the national level. [iii]
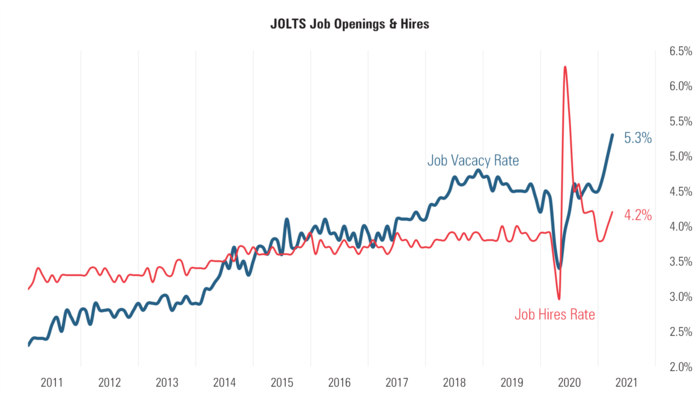
You can see significant improvement in the numbers, suggesting the U.S. labor force is getting back to work.
Another way to look at the employment recovery is with the Beveridge Curve. It is highly technical in nature but, the point is simple. The index—used by policymakers including the Federal Reserve—reflects the intersection of job vacancies and unemployment. This dynamic is perhaps at the heart of what will create more economic equilibrium and less social and economic volatility. [iv]
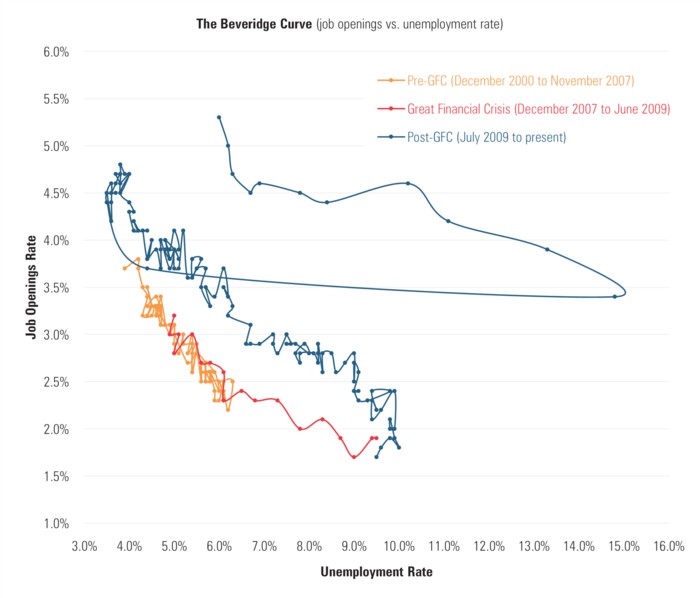
You can see a rapidly improving index after a wild swing at the height of the pandemic.
Unfortunately, the American worker needs childcare and, based upon available data, that is still a significant challenge. [v]
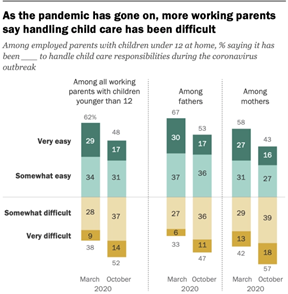
Childcare = Eggs for breakfast. It’s that simple.
If you have questions or comments, please let us know. You can contact us via Twitter and Facebook, or you can e-mail Tim directly. For additional information, please visit our website.
Tim Phillips, CEO, Phillips & Company
Sources:
i. https://www.nass.usda.gov/Publications/Todays_Reports/reports/plva0421.pdf
ii. https://www.bls.gov/news.release/empsit.htm
iii. https://www.bls.gov/jlt/
iv. https://www.bls.gov/charts/job-openings-and-labor-turnover/job-openings-unemployment-beveridge-curve.htm
v. https://www.pewresearch.org/fact-tank/2021/01/26/a-rising-share-of-working-parents-in-the-u-s-say-its-been-difficult-to-handle-child-care-during-the-pandemic/