Peeling Back the Onion

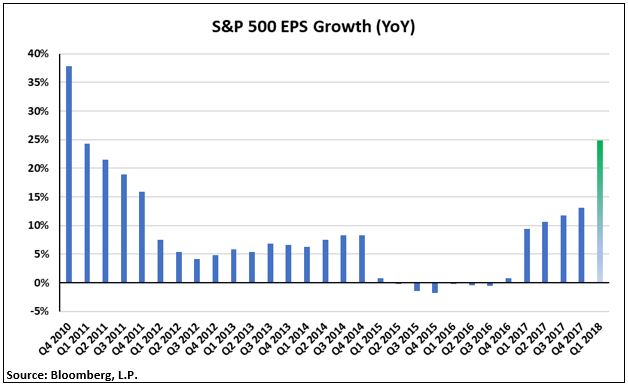
The earnings growth for Q1 2018 was nothing short of spectacular. Approximately 91 percent of companies in the S&P 500 reported results for the first quarter, and EPS is likely to land in the 25 percent growth range. [i] In fact, we have not seen EPS growth of this magnitude since 2010. [ii]
If you dig a bit deeper than the headline earnings per share numbers, you start to see a slightly different picture.
First, the tax cuts have had a significant impact on the earnings growth. [iii]
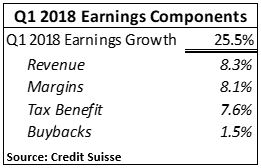
Overall, tax benefits have added 7.6 percent to the 25.5 percent EPS growth. Put another way, 30 percent of the earnings growth for the first quarter is coming directly from tax benefits; tax benefits that won’t provide a boost to earnings growth this time next year. [iii]
Second, much of the earnings growth is being driven by specific sectors.
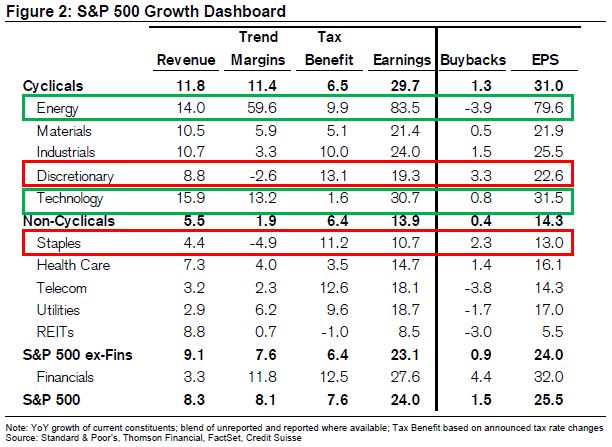
Energy and Technology have reported significant EPS growth of 79.6 percent and 31.5 percent, respectively. Furthermore, much of their EPS growth was driven by revenue growth and profit margin expansion. [iii]
Conversely, and perhaps troubling, is the lack of overall growth from two critical sectors, Consumer Discretionary and Consumer Staples. Both sectors are showing strong EPS growth; however, much of the growth is driven by tax benefits compared to revenue growth. In fact, out of the eleven sectors in the S&P 500, these two sectors saw their margins contract. Tax cuts added 13.1 percentage points to Consumer Discretionary EPS growth compared to 8.8 percentage points from revenue, while margins contracted by 2.6 percentage points. [iii]
Looking at Consumer Staples, you get a similar picture. Tax cuts added over 11 percentage points to EPS growth compared to the slightly more than 4 percentage points added by revenue, while margins contracted by 4.9 percentage points. Again, margin compression was the main drag on EPS growth. [iii]
Here is a list of items that are considered Consumer Discretionary: [iv]
- Automobiles
- Books
- Household appliances
- Consumer electronics
- Furniture
- Tools
And here is a list of items that are considered Consumer Staples: [iv]
- Food and Beverage
- Tobacco
- Clothing
- Gasoline
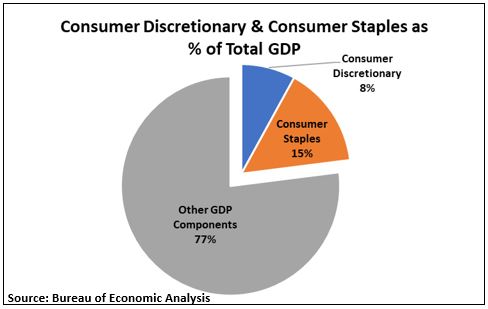
These are not small items, especially when you look at the contribution these sectors make to our overall economy [iv].
When you overlay the more nuanced version of earnings growth, compared to the continued strength in consumer sentiment (released this past Friday), it’s getting easier to suggest that consumers might be cooling down a bit from high levels of consumption. [v]
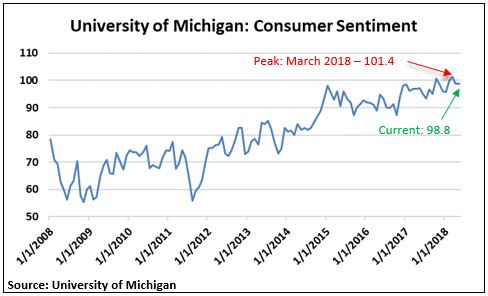
While consumer sentiment remains at elevated levels, it appears to have peaked back in March. [v]
More likely than an economic pullback, we are probably seeing some specific trends in both Consumer Staples and Consumer Discretionary.
According to Credit Suisse, here are some reasons why we are seeing pressure in these sectors: [iii]
- Margin compression stemming from a lack of pricing power and rising input and commodity costs
- A normalization of new car sales coming off highly elevated levels
- Structural headwinds for many brick-and-mortar retailers, partially offsetting growth in internet retail and online media distribution
We might get a little teary-eyed when we peel back the onion on corporate earnings, but things continue to look strong for 2018.
Here is an interesting question: how will companies beat such strong earnings growth next year? Maybe Wall Street will strip out tax benefits from earnings projections and shape a different narrative, or perhaps we will have some real tears when we begin to anticipate what Q1 2019 looks like.
If you have questions or comments, please let us know. You can contact us via Twitter and Facebook, or you can e-mail Tim directly. For additional information, please visit our website.
Tim Phillips, CEO, Phillips & Company
Robert Dinelli, Investment Analyst, Phillips & Company
References:
i. https://insight.factset.com/hubfs/Resources%20Section/Research%20Desk/Earnings%20Insight/EarningsInsight_051118.pdf
ii. Bloomberg, L.P.
iii. https://PHILLIPSANDCO.COM/files/6815/2632/1521/CSFB_Q1_report.pdf
iv. https://www.bea.gov/newsreleases/national/gdp/2018/pdf/gdp1q18_adv.pdf
v. http://www.sca.isr.umich.edu/charts.html