Reduce the IRS Tax Bite with Municipal Bonds
Another tax season is over, making this an excellent time to examine the size of the tax bite that you sustained and to consider strategies to reduce your taxes for coming year. The 2013 tax year included two changes that may have increased your taxes: a 39.6% marginal tax rate for those with adjusted incomes over $400,000 / $450,000 (single/married filing jointly) and a 3.8% surtax (part of the Affordable Care Act) on investment income for those with adjusted income over $200,000 / $250,000 (single/married filing jointly). [i,ii]
Together these changes created an effective top marginal tax rate of 43.4%, which is plenty of reason to consider tax-exempt investments, such as municipal bonds. Municipal bonds (munis) are debt issued by states and municipalities whose income is exempt from federal income taxes. The graph below compares Treasury, Corporate, and Municipal bond yield curves and the dark blue line shows the tax-equivalent yields for the muni’s curve, assuming a 43.4% tax rate.[iii,iv]
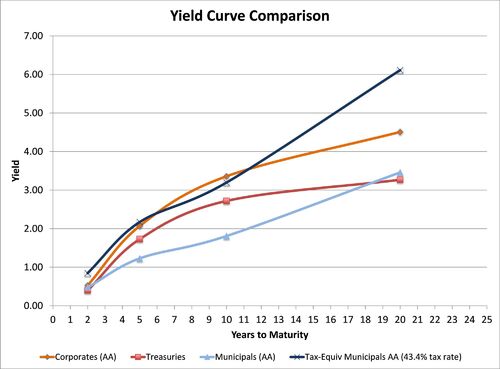
For those in the highest tax bracket, munis generally offer a higher tax-equivalent yield than similar-grade corporate bonds. In many cases, munis are also exempt from state income taxes, which would increase the tax-equivalent yield. Here in Oregon, this could provide an additional tax savings of around 9%.
With recent headlines about Detroit in bankruptcy and Puerto Rico potentially defaulting on its debt, investors may be concerned about the safety of municipal bonds. Fortunately, these high profile municipalities are not the norm.
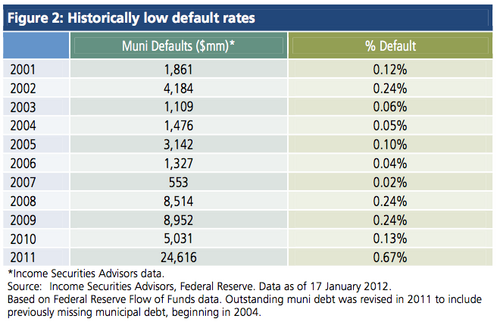
As observed in the table below, from 2001-2011 the muni default rate was below 0.25%, except in 2011.[v] Even then, most of the default value was concentrated in 4 issues, so proper diversification can mitigate default risk. By comparison, Moody’s reported a corporate bond default rate of 2.9% in 2013 and projects a 2.2% rate for 2014.[vi]
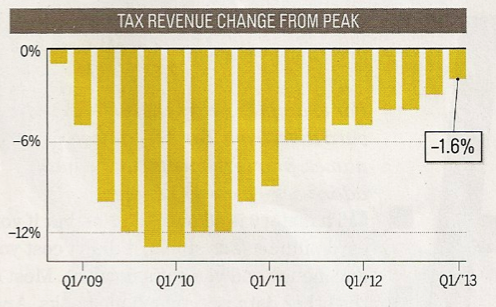
Furthermore, state finances have improved. Total state tax revenue has nearly recovered to its pre-financial-crisis level.[vii]
Insurance provides another level of safety for many munis, though since the financial crisis, insurance on new bonds declined significantly.[viii]
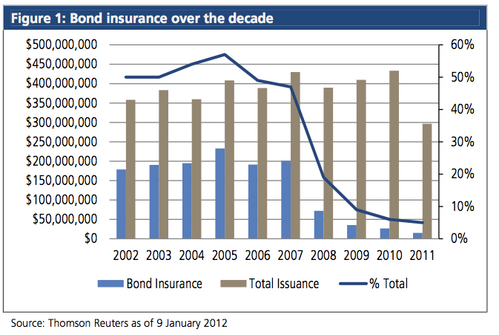
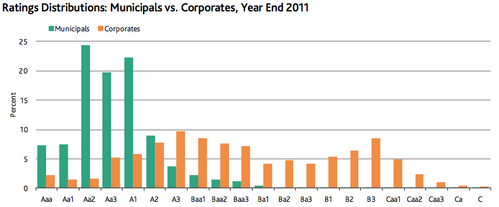
However, most munis have investment-grade credit ratings compared to a wide range of ratings for corporate bonds.[ix] Between the high credit ratings and low default rate, insurance may not be a large concern for muni investors.
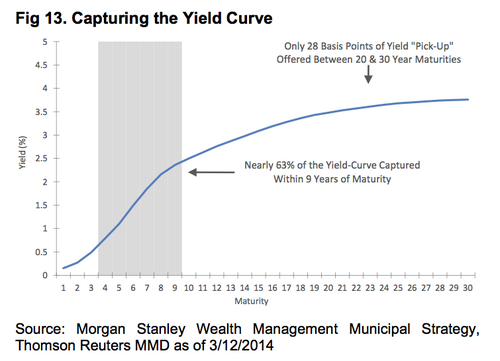
As with all bond investments, munis are subject to interest rate risk. Shorter duration bonds will be less sensitive to rising rates, however CNN Money noted that the 3- to 5-year munis are richly priced at the moment.[x] In the graph below, Morgan Stanley recommends considering the 4- to 9-year range, as it captures nearly 63% of the yield curve, providing some cushion against rising short-term rates and the potential for capital gains if short-term rates stay low.[xi]
Based on the data, municipal bonds are worth consideration, particularly for investors in the higher tax brackets. Compared to similar-grade corporate bonds, munis offer potentially higher tax-equivalent yields and safety. Contact your advisor to learn more about municipal bonds and opportunities to reduce next year’s tax bite.
If you have questions or comments, please let us know as we always appreciate your feedback. You can get in touch with us via Twitter, Facebook, or you can email me directly. For additional information on this, please visit our website.
Jeff Paul, Senior Investment Analyst – Phillips & Company
Tim Phillips, CEO – Phillips & Company (Editor)
[i] TaxFoundation.org. US Federal Individual Income Tax Rates History, 1863-2013.
[ii] Saret, L. (Mar 14, 2013). What the New 3.8% Medicare Surtax Means for You and Your Investments. Forbes.
[iii] Yahoo Finance (Apr 19, 2014). Composite Bond Rates.
[iv] US Department of the Treasury (Apr 19, 2014). Daily Treasury Yield Curve Rates.
[v] Deane, J., et. al. (Feb 2012). Credit Counts: The New Municipal Bond Market. PIMCO.
[vi] Monga, V. (Mar 3, 2014). Moody’s Predicts Drop in 2014 Corporate Default Rate. The Wall Street Journal.
[vii] Fried, C. (Apr 2014). Munis on the Rise. Money. p. 81.
[viii] Deane, J., et. al. (Feb 2012). Credit Counts: The New Municipal Bond Market. PIMCO.
[ix] Moody’s Investors Service (Mar 7, 2012). U.S. Municipal Bond Defaults and Recoveries, 1970-2011. Moody’s. p. 3.
[x] Fried, C. (Apr 2014). Munis on the Rise. Money. p. 81.
[xi] Dillon, J. and Gastall, M. (Mar 13, 2014). Municipal Bond Monthly. Morgan Stanley. p. 7.
Disclosures
Bond investing poses special risks, including the credit quality of individual issuers, possible prepayments, market or economic developments and yield and share price fluctuations due to changes in interest rates. When interest rates go up, bond prices typically drop, and vice versa.
Yield Curve Comparison is based on combined federal income tax rate of 43.4%. This chart is intended for hypothetical illustration only and is not intended to be representative of the past or future performance of any particular investment.
Municipal bond income is generally exempt from Federal and state taxes for residents of the issuing state. While the interest income is tax-exempt, any capital gains distributed are taxable to the investor. Income for some investors may be subject to the Federal Alternative Minimum Tax (AMT).
Insurance pertains to the timely payment of principal and interest by the issuer of the underlying securities, and not to the value of the fund’s shares. Insurance applies to the payment of principal and interest payments. The insurance does not guarantee the original price or current market value of the bonds.