Salt in the Wound

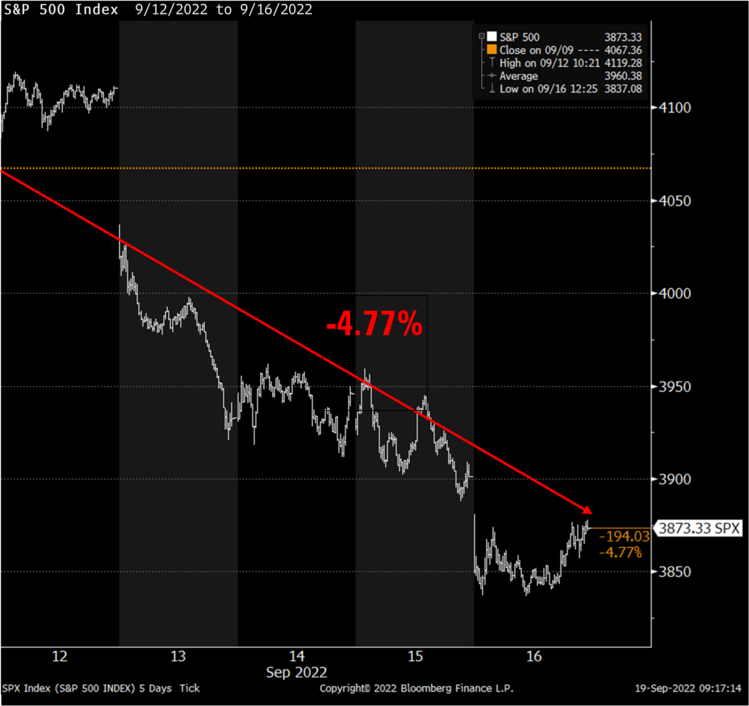
Last week’s extreme negative market reaction to recent inflation data adds more salt in the wound. With an almost certain 75bp rate increase coming this week, the S&P 500 dropped 4.77% last week in anticipation of the lift. 1
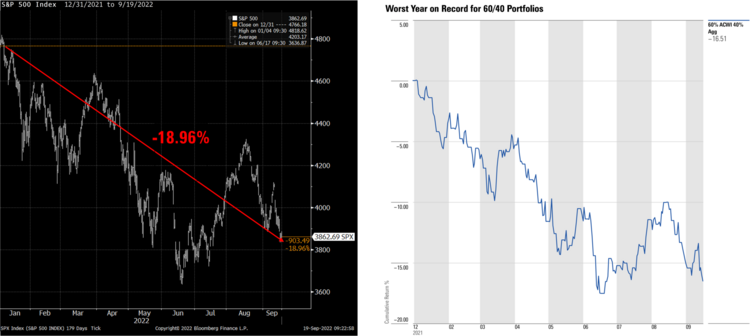
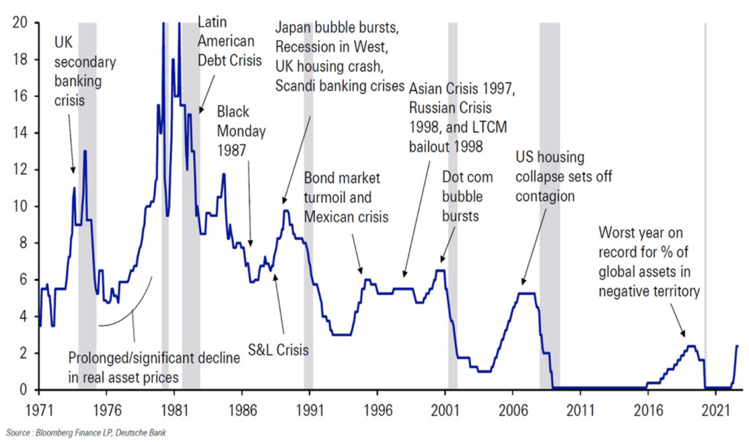
This year the S&P 500 is down 19% and the conservative 60/40 (equity/fixed income) portfolio is down over 16%. It’s the worst year on record for conservative investors. 1 2
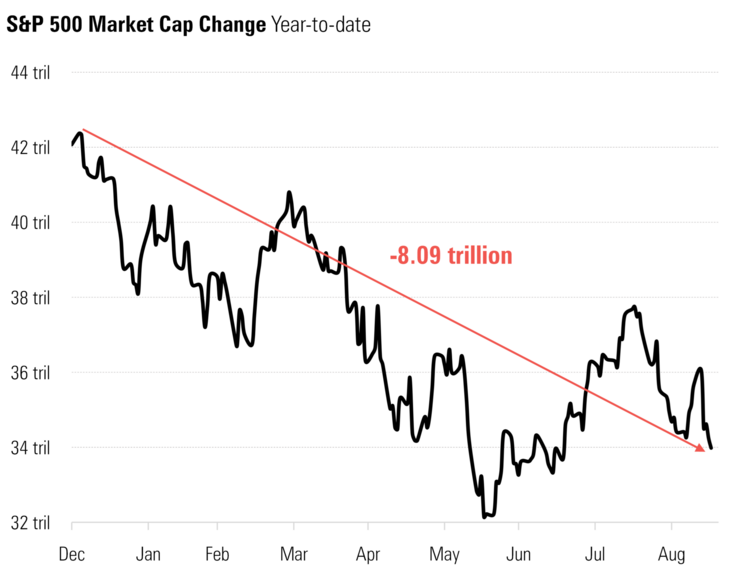
Over $8 trillion in wealth has been wiped of the balance sheets of Americans in this latest bear market. 1
At this stage in the cycle, investor exhaustion typically sets in and reasonable questions emerge, like:
- How long will this last?
- How low can this go?
- Am I going to be ok?
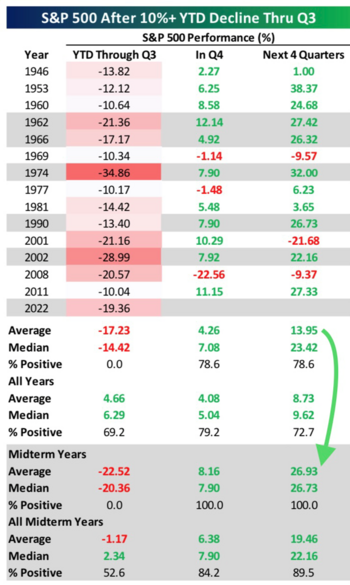
Our friends from Bespoke can shed some light on some of these questions. Typically, when the S&P 500 is down over 10% through the third quarter, the next four quarters end up much better. The average recovery is nearly 14% and in midterm election years, that average accelerates to about 27%. 3
How is this possible one might ask? Many of these dramatic drawdowns were preceded or accompanied by interest rate hikes. 4
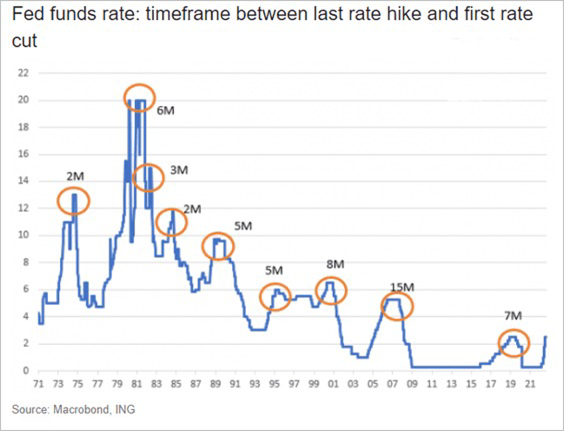
While those hikes cause some pretty significant pain for investors, the period of time those rates sit at elevated levels is pretty short lived. The average time period between the last interest rate hike by the Fed and first rate cut is 6 months. 5
It’s not that hard to comprehend that rate increases cause pain and a depression in consumer behavior. When consumers pull back on their consumption, they create a deflationary cycle.
One dirty little secret central bankers and those of us that have been investing for several decades know, is that inflation is a cakewalk to defeat compared to deflation.
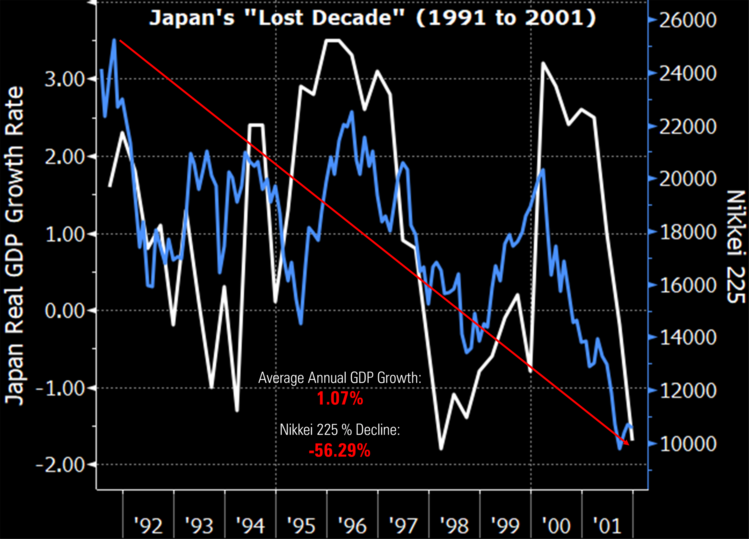
Just think about Japan and the lost decade they experienced when their central bank allowed them to drift into a deflationary cycle.
One tool central banks have to combat deflation is cutting rates and they do that quickly, as you can see from the previous chart showing the duration between the last rake hike and the first rate cut.
According to Goldman Sachs, corporate earnings recessions accompany economic recessions. If we slip into a recession – and that’s still in doubt – earnings will likely contract the most in homebuilders, capital goods, and auto manufactures. They expect an earnings decline of around 11%, perhaps less that the average earnings decline of 13% during recessions. 6
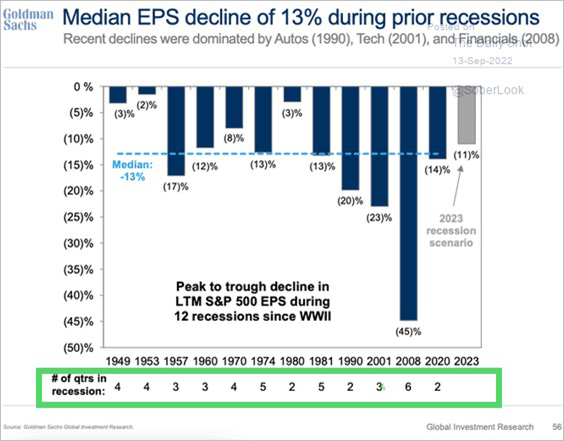
The real highlight isn’t the earnings decline, but the limited time spent in recessions. Again, much of that is aligned with interest rate cuts occurring not too long after the Fed finishes raising rates.
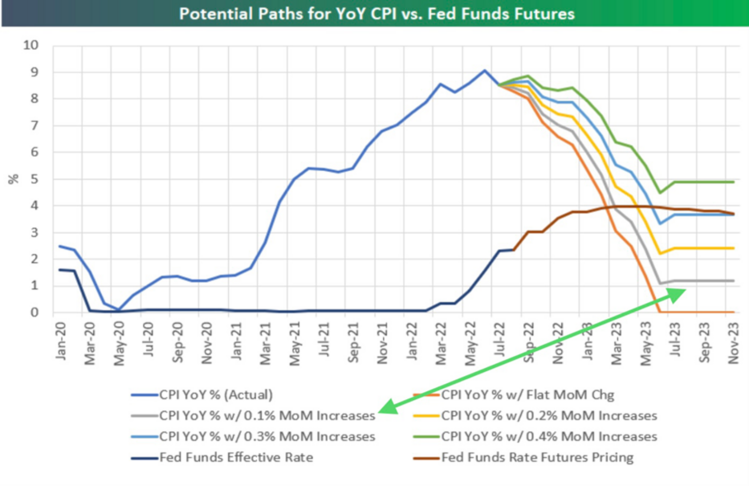
The good news is inflation will continue to moderate if for no other reason than we are heading into some pretty strong year-over-year inflation comparisons. Our recent print on inflation was a month-over-month increase of 0.1%. That puts us on the gray line and if that is the trend, then we should be well below the Fed’s 2% inflation target by mid-2023. (Probably coinciding with rate cuts) 3
If history is any guide, we should be closer to the end of this cycle that the beginning. The pain we are feeling will pass.
Will you be ok? The process is simple, if you don’t attack your principal investment account beyond planned spending, you should be able to weather the storm. Again, this is predicated on having a plan. If you don’t have a plan, you must get one. Your plan is one thing keeping you from making the critical error most investors make: Trying to time the markets. 7
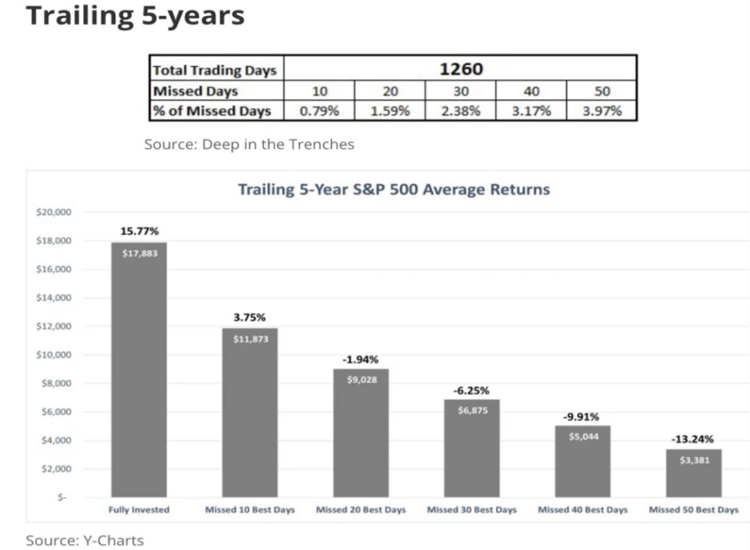
The problem is if you just miss a small fraction of the best returns (less than 1% of the time) you cut your returns by more than 75%. That’s some serious salt in the wound.
If you have questions or comments, please let us know. You can contact us via Twitter and Facebook, or you can e-mail Tim directly. For additional information, please visit our website.
Tim Phillips, CEO, Phillips & Company
Sources:
- Bloomberg
- Morningstar Direct
- https://www.bespokepremium.com/
- https://www.dbresearch.com/PROD/RPS_EN-PROD/RPSHOME.alias
- https://seekingalpha.com/article/4541302-95-billion-in-monthly-liquidity-reduction-to-begin-today
- https://research.gs.com/
- https://deepinthetrenches.com/missing-the-best-days-in-the-market/