That Was Ugly
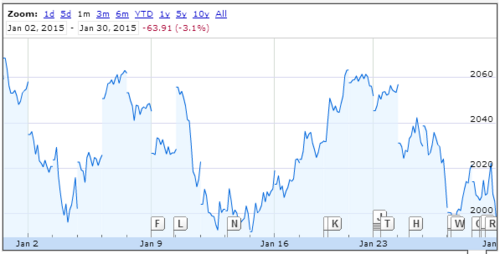
With a large sigh of relief, we watched January fade to black. The US equity markets were down over 3% in the month.[i]
Underlying their decline is some telling data that should come as no surprise to investors.
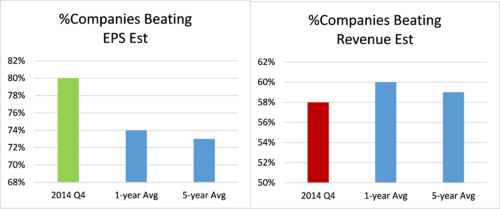
First, S&P 500 corporate earnings growth expectations were about 1.7%.[ii] Very meager compared to the 8.8% estimate back in early October.[iii] According to FactSet, 227 of the S&P 500 companies have reported earnings growth of 2.1% and revenue growth of 1.4%. 80% of companies reported earnings above estimates and 58% reported revenue above estimates. It's a bit of a split decision relative to the averages.[iv]
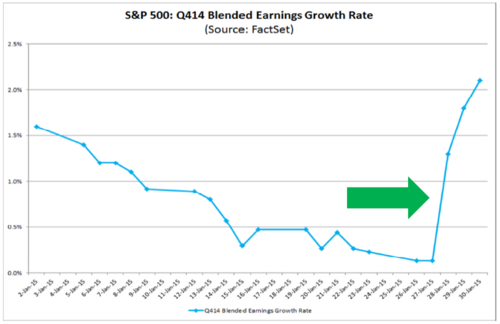
Unfortunately, Apple accounted for about 50% of the S&P 500’s earnings growth rate, as evidenced by the chart below. If Apple had reported actual EPS that matched the mean EPS estimate, instead of its 17.5% earnings beat, the S&P 500’s earnings growth rate would be 1.1% rather than 2.1%.[v]
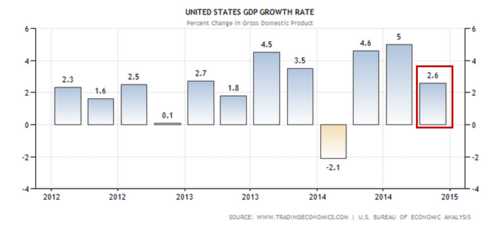
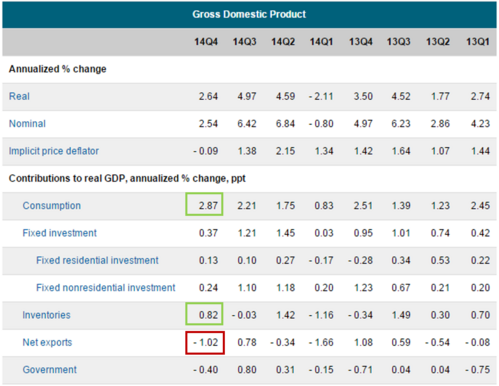
Not surprisingly, and as noted in our past blog and look ahead, we also encountered some slowing in growth for the US economy. US GDP grew at a much reduced pace in the 4th quarter than Q3 2014.[vi]
The predictable components of the GDP numbers were the very strong consumer spending numbers, while the big drag was in the trade balance (exports-imports).[vii,viii]
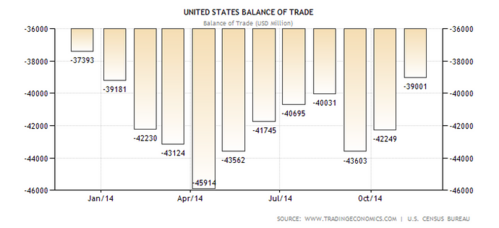
As we have discussed, the blistering strong dollar has created some headwinds for large companies and simultaneously created some very cheap overseas goods for US consumers to devour. For example, Proctor and Gamble shaved off 5% of its revenue and 14% of its core earnings per share due to the dollar’s strength.[ix]
As we opined in our Quarterly Look Ahead, the US Consumer can hold up the world for a while and perhaps emerging markets can sort themselves out in the meantime. I put it at a couple of quarters before we see some consumer headwinds.
Eyeballs on the Target
Here is what we are looking at very closely as the strong dollar, trade deficit, disinflationary expansion cycle unfolds:
- Catalysts that can impact the dollar.
- Continued sanguine US corporate earnings.
- Foreign treasury rates (10-year) as a directional indicator of US Treasuries.
- Consumer spending habits in light of the low gasoline price windfall.
What we will likely experience in this phase of the cycle is much more volatility and perhaps a full-fledged correction if earnings limp along at a below estimate pace.
Hang on because your resolve will be tested and hopefully your conviction in your plan will not weaken. Remember, you need some degree of risk to generate returns. Let’s just make sure it's the right level of risk. That's why your advisor is here for you.
If you have questions or comments, please let us know as we always appreciate your feedback. You can get in touch with us via Twitter, Facebook, or you can email me directly. For additional information on this, please visit our website.
Tim Phillips, CEO – Phillips & Company
Jeff Paul, Senior Investment Analyst – Phillips & Company
References
[i] Google Finance. (Feb 2, 2015). S&P 500 chart.
[ii] Butters, J. (Jan 30, 2015). Earnings Insight. FactSet. p 1.
[iii] Butters, J. (Oct 3, 2014). Earnings Insight. FactSet. p 8.
[iv] Butters, J. (Jan 30, 2015). Earnings Insight. FactSet. p 4-5.
[v] Ibid. p 2.
[vi] TradingEconomics. (Feb 2, 2015). United States GDP Growth Rate.
[vii] TradingEconomics. (Feb 2, 2015). United States Balance of Trade.
[viii] Hoyt, S. (Jan 30, 2015). United States: GDP. Moody’s Analytics.
[ix] SeekingAlpha.com. (Jan 27, 2014). Procter & Gamble’s Q4 2014 Results – Earnings Call Transcript.