The Crossover Point

As the U.S. economy is on the mend and moving toward a “return to normal” we need to be mindful of the extraordinary inputs the U.S. Consumer has been living on.
The combination of transfer payments, one-time payments, rent abatements, and expanded unemployment benefits are soon to fade into the sunset.
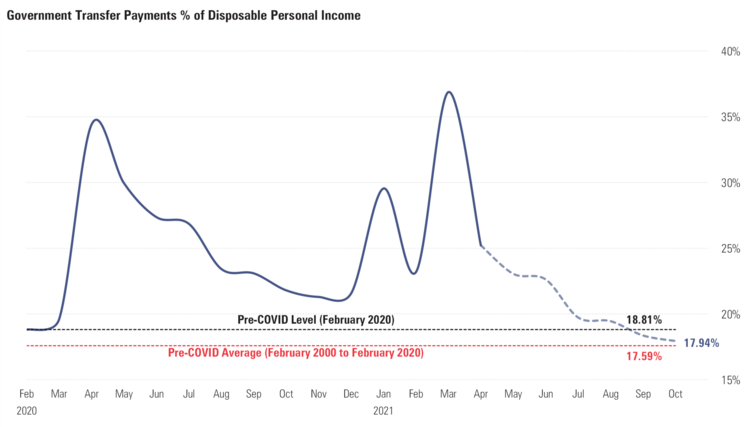
Transfer payments (money from the U.S. Government to individuals) will be phased out by early September. [i]
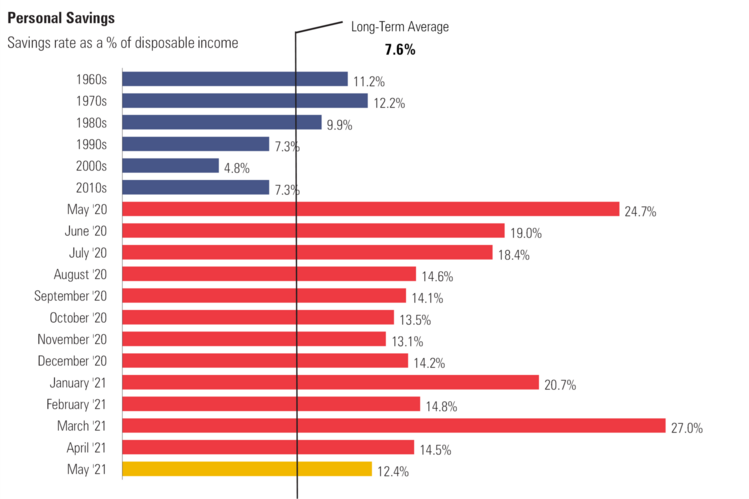
While it’s hard to quantify the impact of the various one-time payments the U.S. Consumer has received, we know they have stashed much of that money in their savings accounts.
U.S. savings rates as a percentage of disposable personal income is still at elevated levels. Historically, and across economic conditions, the U.S. savings rate has averaged 7.6%. [ii]
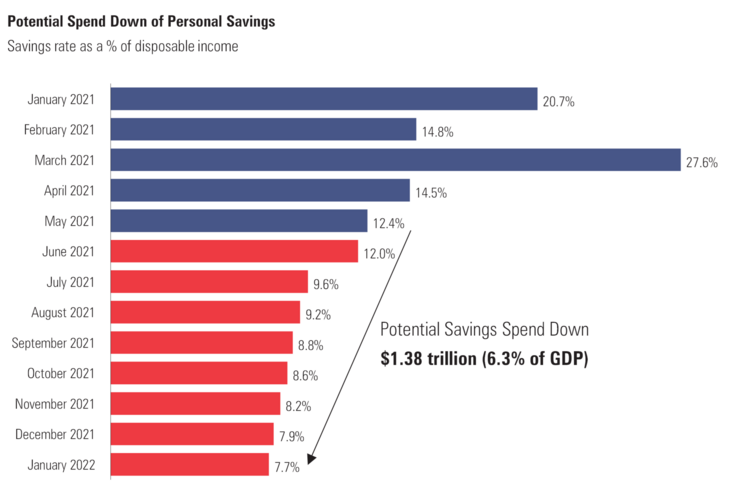
Looking forward, we could see the consumer spend down their precautionary savings and return to historic averages by January 2022.
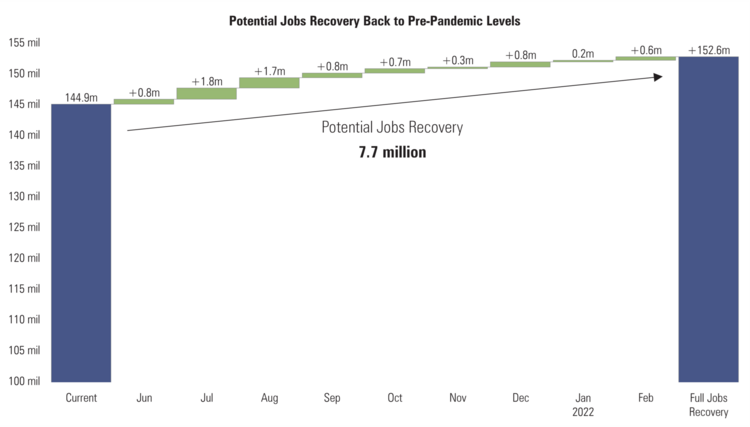
We are still 7.6 million jobs below pre-pandemic levels. [iii]
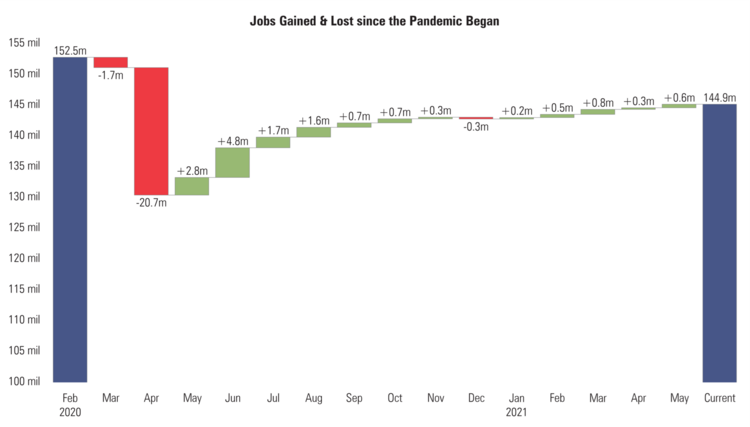
We could see those jobs reemerge in the coming 9 months.
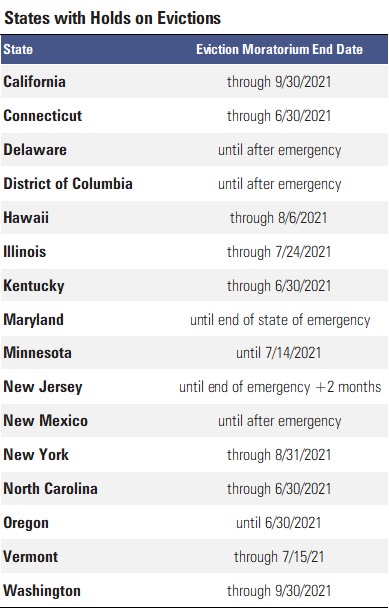
On top of all of this, rent abatements and eviction moratoriums are expected to end in the near future for most states. [iv]
We are facing an unprecedented crossover point in the economy as we ween ourselves off government support to a more self-sustaining economy. Based upon the various inputs, we think we should be back to “normal” between 6 and 9 months from now.
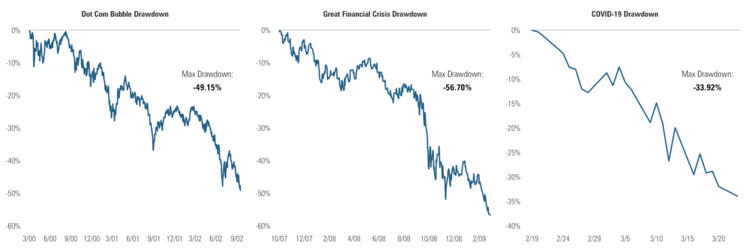
Transitioning the economy is going to come with some imperfections. Those imperfections might create some unwelcome chaos in our equity markets. While I do not expect the massive drawdowns of past painful economic events described in the charts below, I do suspect we will face a series of corrections. [v]
Typical corrections occur on a more frequent basis and that might be part of our return to normal. On average,10% corrections occur once per year and 5% corrections occur 3 times per year.
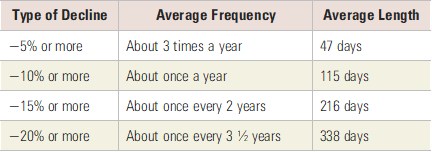
It’s been 462 days since the S&P 500 has had a 10% correction and 278 since we had a 5% correction.
The economic crossover point might mean return-to-normal market gyrations. Let’s be prepared.
If you have questions or comments, please let us know. You can contact us via Twitter and Facebook, or you can e-mail Tim directly. For additional information, please visit our website.
Tim Phillips, CEO, Phillips & Company
Sources:
i. https://fred.stlouisfed.org/graph/?g=F3ne
ii. https://fred.stlouisfed.org/graph/?g=F3on
iii. https://fred.stlouisfed.org/graph/?g=F3oZ
iv. https://www.nolo.com/evictions-ban
v. https://www.bloomberg.com/quote/SPX:IND