The Curve Is Normal, Are We?

In the world of interest rates, things have finally returned to normal. Short-term rates are now lower than long-term rates and that seems right. Investors should get compensated more for longer duration bonds compared to shorter duration bonds.
The yield curve began to invert in early 2022, driven largely by the Federal Reserve’s swift rate hikes in response to inflationary pressures. Over the course of the last 12-18 months, the 2-year and 10-year Treasury yields were consistently inverted, signaling concerns about an impending recession. This particular inversion was one of the longest in recent history, surpassing previous episodes in the 1970s, 1980s, and the early 2000s. 1
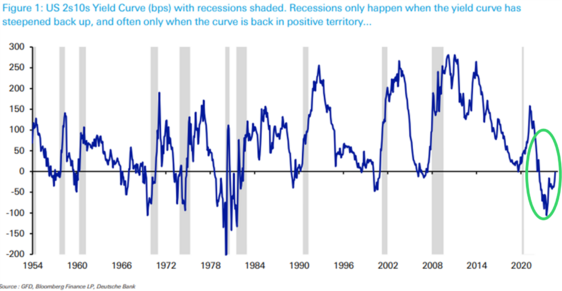
For perspective:
- 1973-1974 Recession: The yield curve inverted for about 10 months before normalizing, leading to a recession.
- 2000-2001 Tech Bubble Burst: The inversion lasted approximately 9 months, eventually coinciding with the recession following the dot-com bubble.
- 2007-2008 Financial Crisis: The yield curve inversion in 2006 lasted around 7 months before the curve normalized and a significant economic downturn followed.
In comparison, the recent inversion lasted for nearly 17 months, marking the longest stretch since the 1980s when high inflation and aggressive Fed rate hikes were commonplace.
Normalization, where longer-term yields again exceed short-term rates, typically signals that the market is recalibrating its expectations. As the curve steepens, it could suggest that fears of an immediate recession are subsiding or that the Fed may soon ease monetary policy. 2
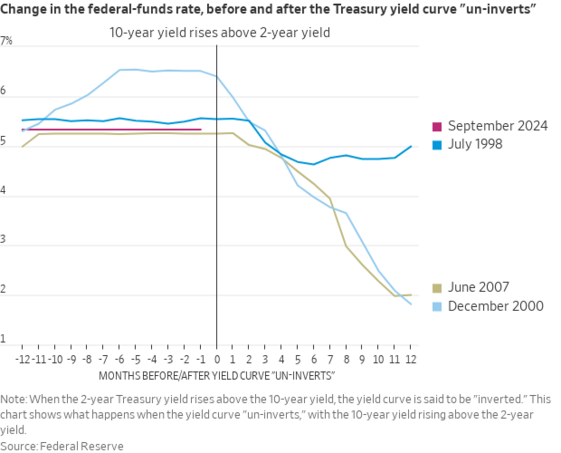
While the normalization can be a sign of market optimism, it does not always guarantee smooth sailing ahead. Again, the Fed cutting short-term interest rates could signal a potential recession and some equity market turmoil. 2
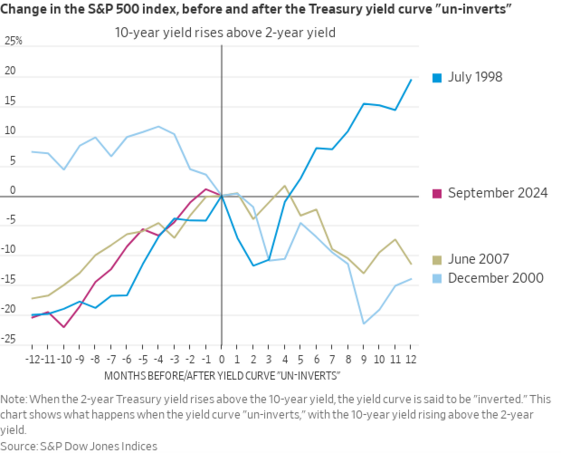
For instance:
- 1989-1990: After the yield curve normalized post-inversion in late 1989, the stock market experienced initial relief, but a recession soon followed, and the S&P 500 declined by over 20% in the next 12 months.
- 2000-2001: Following the dot-com bubble, the equity market struggled even after the yield curve normalized, with the S&P 500 falling 49% from its peak as recessionary pressures mounted.
- 2007-2008: In the run-up to the financial crisis, the yield curve normalized briefly in mid-2007 before the full effects of the credit crisis hit. The S&P 500 declined by over 50% during the subsequent recession.
In contrast, during the mid-1990s, after the curve normalized following an inversion, the U.S. economy experienced a soft landing, and equity markets soared. The S&P 500 gained over 20% the following year, driven by a strong labor market and moderate inflation.
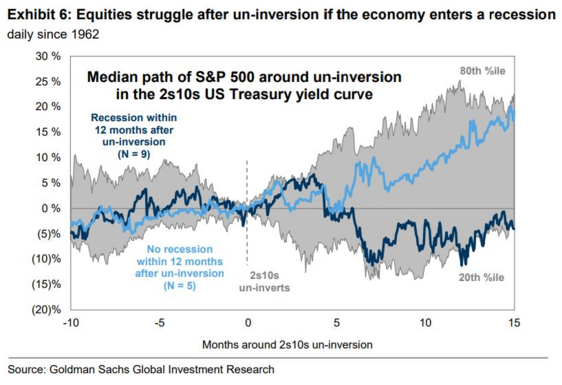
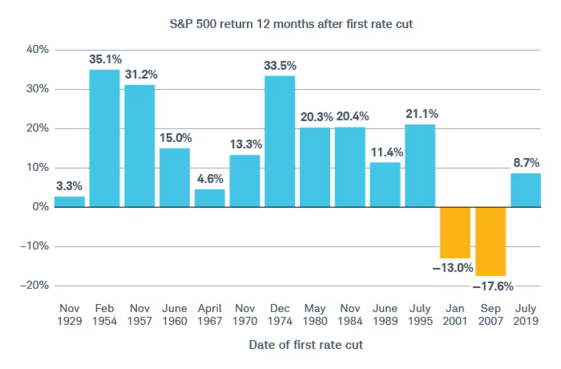
That is certainly the hope and objective of the Federal Reserve today. When rates get cut, equity performance can vary depending on the macroeconomic backdrop. When we face a recession within 12 months of the un-inversion, equity returns suffer. Conversely, when the economy “soft-lands” with no recession 12 months post un-inversion, markets can rally. 3
Here is a look at how the S&P 500 did 12 months after the first interest rate cut. 4
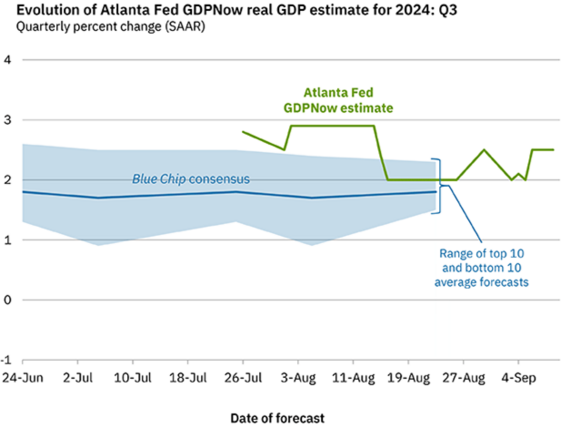
While it’s uncertain about where we will be 12 months from now, it’s hard to believe the economy is currently in a recession. The Atlanta Fed’s GDPNow forecast suggests the economy is growing at a 2.5% pace in Q3. 5
However, I suspect market participants will gyrate between hope and fear until rate cuts come and a soft landing looks more probable. That means living with more volatility.
The odds of a soft landing are still very favorable. However, it’s always good to do a few things now in case the alternative recession scenario occurs:
- Review your spending and liquidity needs. Keep ample liquidity to pay expenses while we survive a typical market cycle. Nothing is worse than needing to withdraw funds from your portfolio while it’s down.
- Review and understand your portfolio drawdowns when recessions occur. That is something we can do for you at any time. Be financially and emotionally prepared.
- Make sure your financial plan and target returns are well aligned. Why take on any more risk than absolutely necessary? We can help you with this as well.
As the curve normalizes let’s make sure we as investors understand our returns, risks, and timeframes. That all seems normal to me.
If you have questions or comments, please let us know. You can contact us via X and Facebook, or you can e-mail Tim directly. For additional information, please visit our website.
Tim Phillips, CEO, Phillips & Company
Sources:
- https://x.com/MattTopley/status/1832078806888411257
- https://x.com/NickTimiraos/status/1831411209821892955
- https://www.linkedin.com/posts/david-kostin-3321146a_usweeklykickstart-activity-7157763249822691328-GCPx
- https://www.schwab.com/learn/story/what-past-fed-rate-cycles-can-tell-us
- https://www.atlantafed.org/cqer/research/gdpnow
The material contained within (including any attachments or links) is for educational purposes only and is not intended to be relied upon as a forecast, research, or investment advice, nor should it be considered as a recommendation, offer, or solicitation for the purchase or sale of any security, or to adopt a specific investment strategy. The information contained herein is obtained from sources believed to be reliable, but its accuracy or completeness is not guaranteed. All opinions expressed are subject to change without notice. Investment decisions should be made based on an investor’s objective and circumstances, and in consultation with their professional tax, financial or legal advisor.