The Signal and the Noise: Breaking the Fever of Inflation
Everyone is talking about inflation these days and the debate is consuming the minds of the pundit and investor classes. Transitory or structural inflation is at the core of the debate. Headline CPI was reported last week at a whopping 5% on a year-over-year basis. [i]
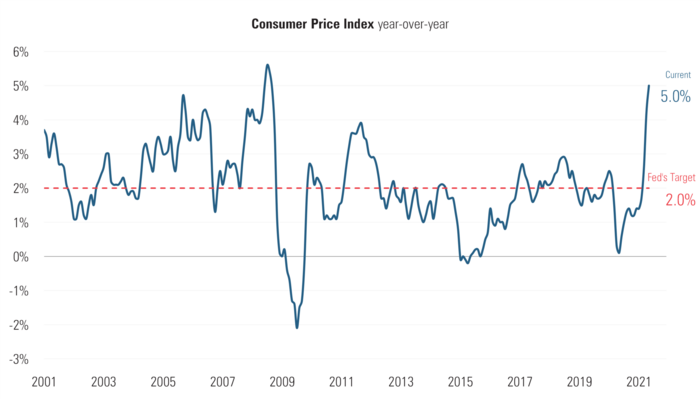
Remember, the Federal Reserve long-term inflation target is 2%.
That report is enough to scare the average investor and even some experienced classic economists. Here’s why I’m not rattled by the noise of the headline at this stage:
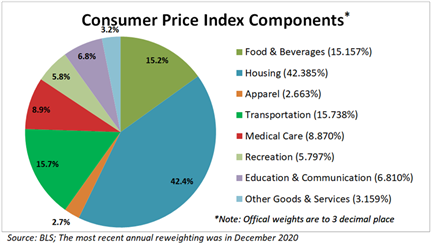
Below are the most recent component weightings of the Consumer Price Index. [i]
Breaking the component parts of the Consumer Price Index down further shows the leading culprits that are driving inflation higher right now. [i]
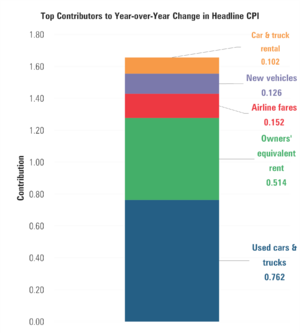
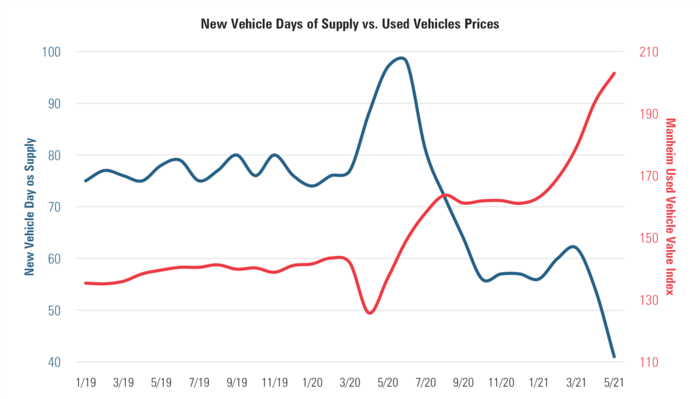
As you can see, the main driver is in Transportation and specifically Used Vehicle prices and Airline ticket prices.
Used vehicle prices are up 48.2% over the last year, driven by the massive chip shortage squeezing the supply of new vehicles. [ii]
Next is truck and car rental prices: Prices were up 11% in May following a 15% jump in April. [i]
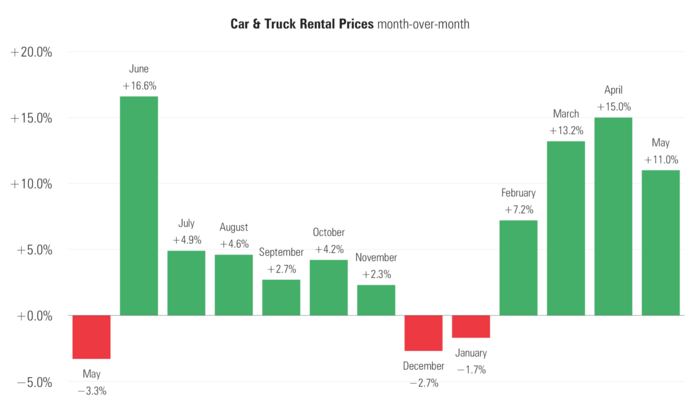
We all know when the economy was shoved into a medically-induced shut down, all of the car rental establishments unloaded their inventory to survive. With the economy reopening, rental car companies are starting to rebuild their inventories. However, the current chip shortage is driving prices temporarily higher.
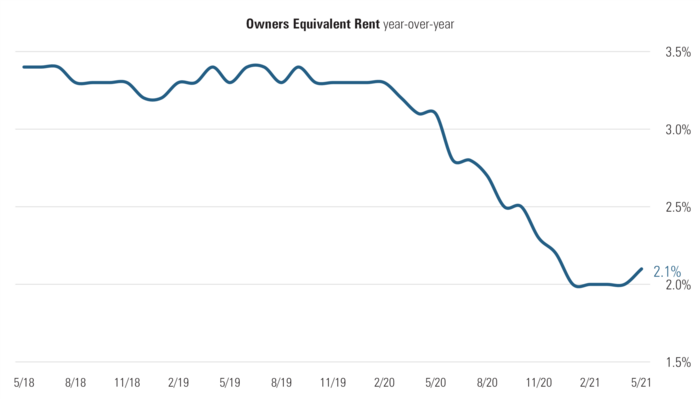
Let’s pivot to housing which is a major component of CPI. The main subset is known as “owner equivalent rent.” Owner equivalent rent does not measure the traditional price of homes but rather the price of equivalent rents for those homes. You can see from the data below those rents have been moderating. [i]
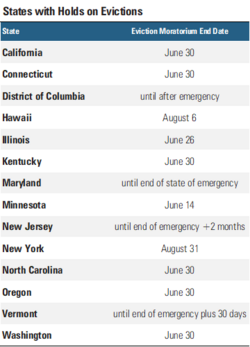
When the moratorium on evictions expires in many states later this year, we could see deflationary pressures in renters’ equivalents. [iii]
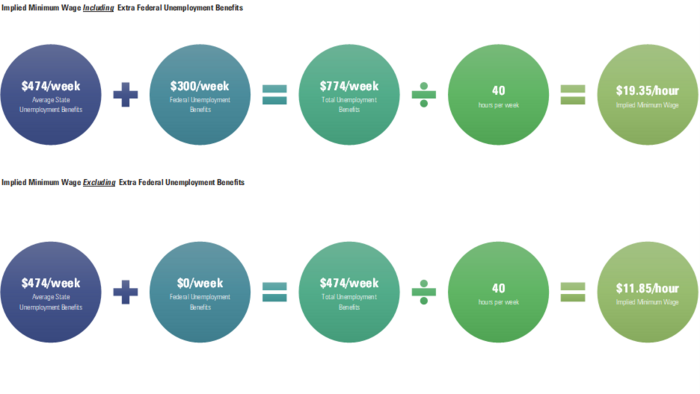
Finally, airline ticket prices spiked mostly driven by a massive lack of supply of labor. With more states cutting off additional unemployment benefits pushing people back to work, we should see these prices normalize. [iv]
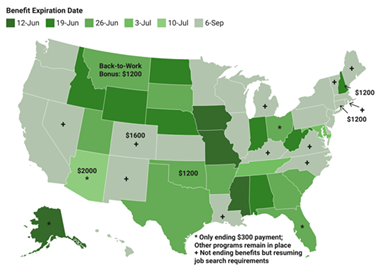
In fact, in four states (Alaska, Iowa, Mississippi, Missouri) additional pandemic benefits ended this past weekend.
Ending these benefits early will pull pressure off wage increases and reduce the risk of an excessive wage-price spiral. Higher wages put more pressure on demand without enough offset in supply. This is demand-pull inflation and it is hard to combat. [v]
Right now, much of the inflation we are seeing is cost-push inflation which is generally transitory. It’s mostly driven by supply shocks (generally in oil but, post-pandemic it could be anything) which should normalize over the next year.
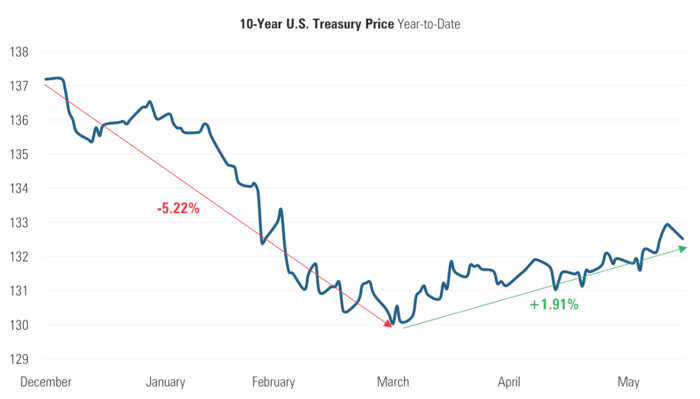
So, what’s my proof that we are in a transitory cost-push inflation environment? Look at the 10-year treasury. The price of the 10-year has risen as investors are grabbing yield while they can before a potential softening of inflation is seen. [vi]
A remedy for cost-push inflation is higher income taxes, which are a quick and immediate cure that will strip out some marginal demand from the economy. While I’m not a fan, it seems to be baked into the cake from policy makers. Inflation, while on a delicate balance between cost-push and demand-pull, should break its fever and normalize in the coming 12 months.
If you have questions or comments, please let us know. You can contact us via Twitter and Facebook, or you can e-mail Tim directly. For additional information, please visit our website.
Tim Phillips, CEO, Phillips & Company
Sources:
i. https://www.bls.gov/news.release/cpi.nr0.htm
ii. https://www.coxautoinc.com/economic_insights_category/data-point/
iii. https://www.nolo.com/evictions-ban
iv. https://research.gs.com/
v. https://fileunemployment.org/dataview/
vi. https://www.cmegroup.com/trading/interest-rates/us-treasury/10-year-us-treasury-note.html